ASX: CAR GROUP LIMITED – CAR Elliott Wave Technical Analysis – TradingLounge
Greetings,
This Elliott Wave analysis presents the latest outlook for CAR GROUP LIMITED – CAR, traded on the Australian Securities Exchange (ASX). Based on current wave structure, we anticipate a possible bullish move in CAR stock, with the ongoing Wave 4 correction nearing its end. This sets the stage for a potential Wave 5 rally, aligning with Elliott Wave principles.
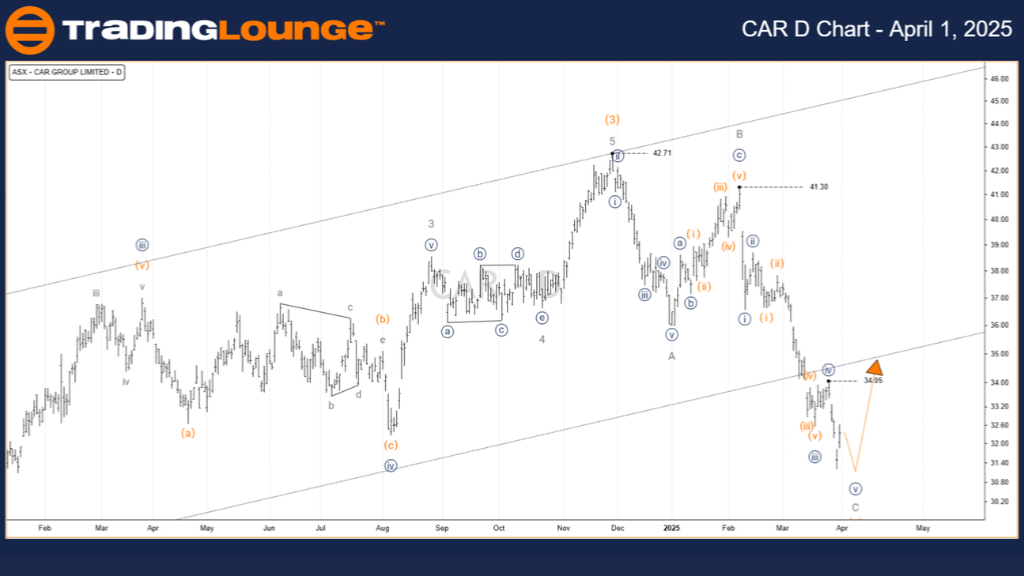
ASX: CAR GROUP LIMITED – CAR 1-Day Chart (Semilog Scale) – Technical Overview
Function: Major Trend (Intermediate Degree – Orange)
Mode: Motive
Structure: Impulse
Current Wave: Wave C (Grey) of Wave (3) (Orange)
Key Analysis:
Wave (3) (Orange) completed near the $42.71 mark. The market is undergoing a corrective phase via Wave (4) (Orange), taking the form of an A-B-C Zigzag (Grey). As the correction approaches completion, a breakout to the upside through Wave (5) (Orange) is increasingly likely.
Critical Invalidation Level: $41.30

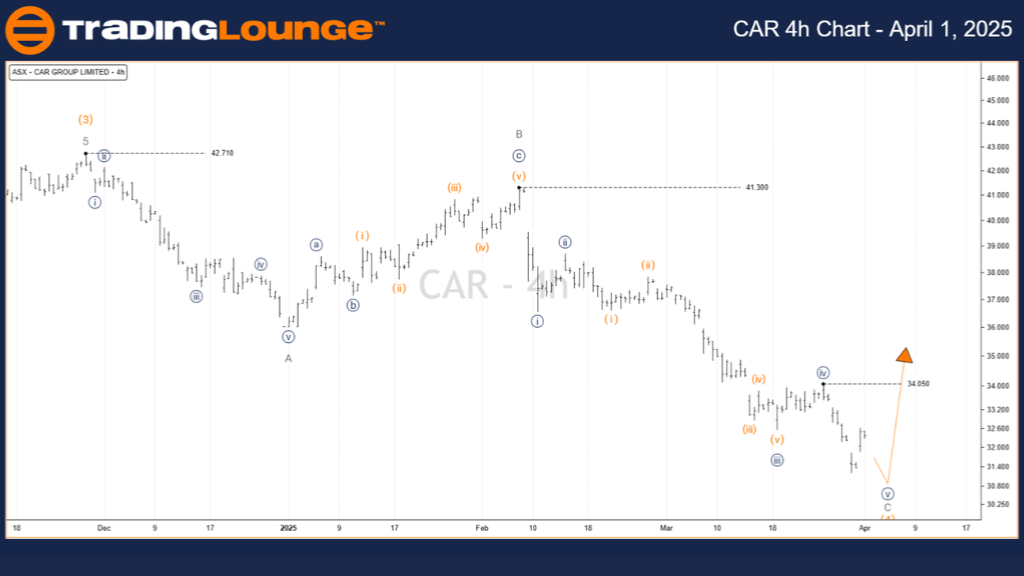
ASX: CAR GROUP LIMITED – CAR 4-Hour Chart – Technical Overview
Function: Major Trend (Minor Degree – Grey)
Mode: Motive
Structure: Impulse
Current Wave: Wave ((v)) (Navy) of Wave C (Grey) of Wave (4) (Orange)
Key Analysis:
Post the $41.30 high, Wave C (Grey) is progressing downward in a five-wave sequence. The final leg, Wave ((v)) (Navy), is in advanced stages of completion. A rise above $34.05 could serve as an initial confirmation of Wave (5) (Orange) beginning.
Critical Invalidation Level: $41.30
Early Confirmation Level: $34.05
Technical Analyst: Hua (Shane) Cuong, CEWA-M (Master’s Designation).
Source: Visit Tradinglounge.com and learn from the Experts. Join TradingLounge Here
See Previous: INSURANCE AUSTRALIA GROUP LIMITED – IAG Elliott Wave Technical Analysis
VALUE Offer - Buy 1 Month & Get 3 Months!Click here
Access 7 Analysts Over 200 Markets Covered. Chat Room With Support

Conclusion
This Elliott Wave analysis for CAR GROUP LIMITED – CAR (ASX:CAR) outlines both intermediate and short-term trading scenarios. The strategic price levels of $41.30 and $34.05 serve as key validation markers, enhancing the reliability of this technical forecast. These insights aim to support traders in navigating market shifts with greater confidence and precision.