03Feb

Cardano (ADAUSD) Elliott Wave Technical Analysis, Price Prediction, Trading Strategies, Support & Resistance, and Market Trends

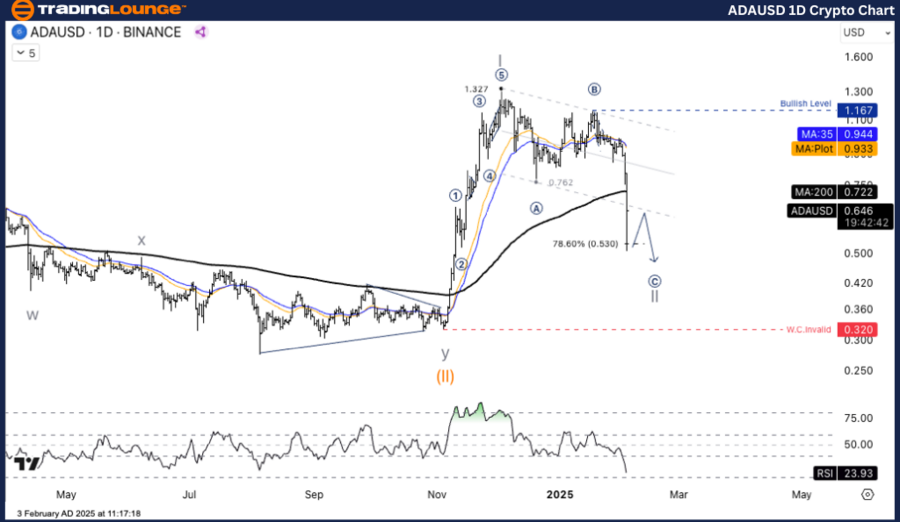
ADA/USD (Cardano to U.S. Dollar) Elliott Wave Analysis - TradingLounge Daily Chart

ADAUSD Elliott Wave Technical Analysis

Function: Counter Trend

Mode: Corrective

Structure: Flat

Position: Wave C

Next Higher Degree Direction:

Wave Cancel Invalid Level:

ADA/USD (Cardano to U.S. Dollar) Trading Strategy:

The current Elliott Wave structure of ADAUSD suggests a correction within Corrective Wave II. This wave could lead the price to test the critical support zone between 0.53 USD and 0.32 USD. Traders should monitor reversal signals from both the wave structure and technical indicators before opening any position.

Trading Strategies

  • Buy Strategy (Long Position):

    • • Wait for ADAUSD to reach the Wave C target near 0.53 USD or for the completion of the price structure. Confirm reversal signals through RSI or other technical indicators before entering a long position.
  • Risk Management:

    • • Exit your position immediately if the price falls below the Wave C Invalid Level (0.32 USD) to minimize losses.

ADAUSD-1d-crypto-cha...


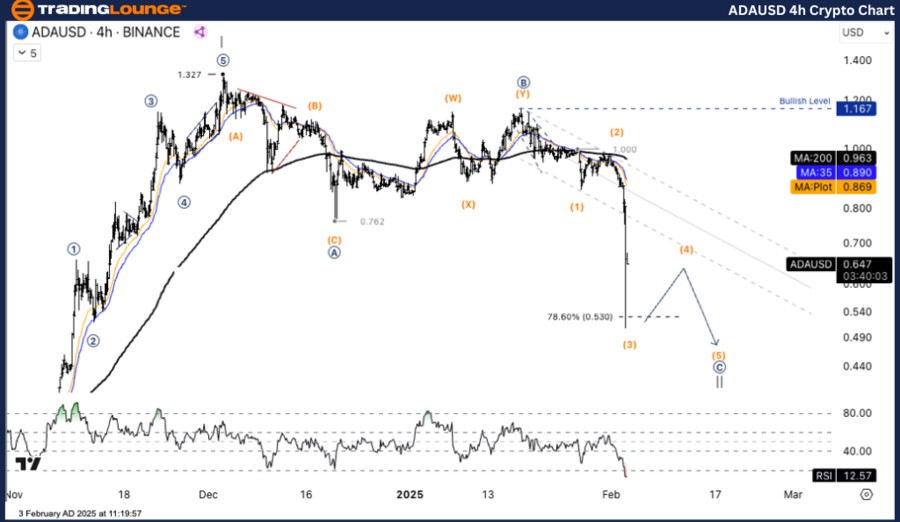
ADA/USD (Cardano to U.S. Dollar) Elliott Wave Analysis - TradingLounge 4-Hour Chart

ADAUSD Elliott Wave Technical Analysis

Function: Counter Trend

Mode: Corrective

Structure: Flat

Position: Wave C

Next Higher Degree Direction:

Wave Cancel Invalid Level:

ADA/USD (Cardano to U.S. Dollar) Trading Strategy:

ADAUSD is currently in a corrective phase as part of Wave II, indicating a potential drop to the key support levels between 0.53 USD and 0.32 USD. Observing reversal patterns and indicator signals is crucial before making any trading decisions.

Trading Strategies

  • Buy Strategy (Long Position):

    • • Consider buying when the price approaches the 0.53 USD support level or when the corrective structure completes. Look for RSI or other technical indicators to confirm the reversal.
  • Risk Management:

    • • To limit risk, close your position if ADAUSD breaks below the Wave C Invalid Level (0.32 USD).

Technical Analyst: Kittiampon Somboonsod

Source: visit Tradinglounge.com and learn From the Experts Join TradingLounge Here 

Previous: ETHUSD Elliott Wave Technical Analysis

VALUE Offer - Buy 1 Month & Get 3 Months!Click here

Access 7 Analysts Over 200 Markets Covered. Chat Room With Support

ADAUSD-4h-crypto-cha...

Related

Costco Wholesale Corp.(COST:NASDAQ) Elliott Wave Technical Analysis 11 December 23

Costco Wholesale Corp.(COST:NASDAQ) Elliott Wave Technical Analysis 11 December 23

Costco Wholesale Corp.(COST: NASDAQ) Elliott Wave Technical Analysis Dated 11 December 23 with 1-Hou...

Read More >
Mastercard (MA) Elliott Wave Analysis Reveals Bullish Trend Potential or Imminent Correction Based on Current Wave Count Structure

Mastercard (MA) Elliott Wave Analysis Reveals Bullish Trend Potential or Imminent Correction Based on Current Wave Count Structure

Analyze Mastercard’s (MA) price movement using Elliott Wave theory. The current chart suggests a bu...

Read More >
New Zealand Dollar/U.S.Dollar (NZDUSD) Forex Elliott Wave Technical Analysis: Comprehensive Market Forecast

New Zealand Dollar/U.S.Dollar (NZDUSD) Forex Elliott Wave Technical Analysis: Comprehensive Market Forecast

This article provides an in-depth Elliott Wave Analysis of the NZDUSD pair on both the daily and 4-h...

Read More >
MARA Holdings Inc. (MARA) U.S. Stocks Elliott Wave Technical Analysis: Shows Bullish Price Move and Weekly Resistance Nearing

MARA Holdings Inc. (MARA) U.S. Stocks Elliott Wave Technical Analysis: Shows Bullish Price Move and Weekly Resistance Nearing

This analysis of MARA Holdings uses Elliott Wave theory to project price moves on daily and weekly c...

Read More >
DOTUSD Elliott Wave Analysis: Polkadot Price Prediction, Trading Strategy, Market Trends, Support and Resistance Levels Insights

DOTUSD Elliott Wave Analysis: Polkadot Price Prediction, Trading Strategy, Market Trends, Support and Resistance Levels Insights

DOTUSD Elliott Wave analysis offers valuable insights into Polkadot's price prediction, trading ...

Read More >
Elliott Wave Analysis: SP 500, NASDAQ, AAPL, AMZN, NVDA, META, NFLX, GOOGL, MSFT, TSLA, BITCOIN

Elliott Wave Analysis: SP 500, NASDAQ, AAPL, AMZN, NVDA, META, NFLX, GOOGL, MSFT, TSLA, BITCOIN

US Tech stock and indices are approaching Elliott Wave Primary 3) degree. Expect lower trading volum...

Read More >

$1 for 2 Weeks

then $29 a month!

What a Special Offer!

Trade Recommendations

Unleash the power of deversified trading with our comprehensive portfolio, covering 250+ markets:

  • Stock Trades
  • Crypto Trades
  • Forex Trades
  • Commodity Trades
Elliott Wave Analysis

Gain a competitive edge with expert insights and AI-powered Elliott Wave charting into:

  • Global Indices
  • US Stocks & ASX Stocks
  • Forex & Crypto
  • Commodities
Top-Notch Trading Tools

Equip yourself with the tools of success:

  • Real-time Chat rooms
  • Elliott Wave Algorithm
  • Portfolio tools
  • TradingLevels
  • Screener
  • Trading Game
7 Elliott Wave Analysts

Stay ahead of the market with daily charts and insightful videos
Your secret to strategic trading!

JOIN HERE


Welcome to TradingLounge (ASIC A.R.No. 321187), specialists in trades, trading education and technical analysis, covering stocks, indices, commodities, forex and cryptocurrencies.

When you join TradingLounge you have access to everything we offer, including trade tools, educational content and a social platform to chat with like-minded investors.

Read more

@Copyright 2024 by tradinglounge.com

Contact Us

Australian no: 02 4787 6020

International no: +61 (2) 47876020

Pay with:

Find us on