03Jul

MARA Holdings Inc. (MARA) U.S. Stocks Elliott Wave Technical Analysis: Shows Bullish Price Move and Weekly Resistance Nearing

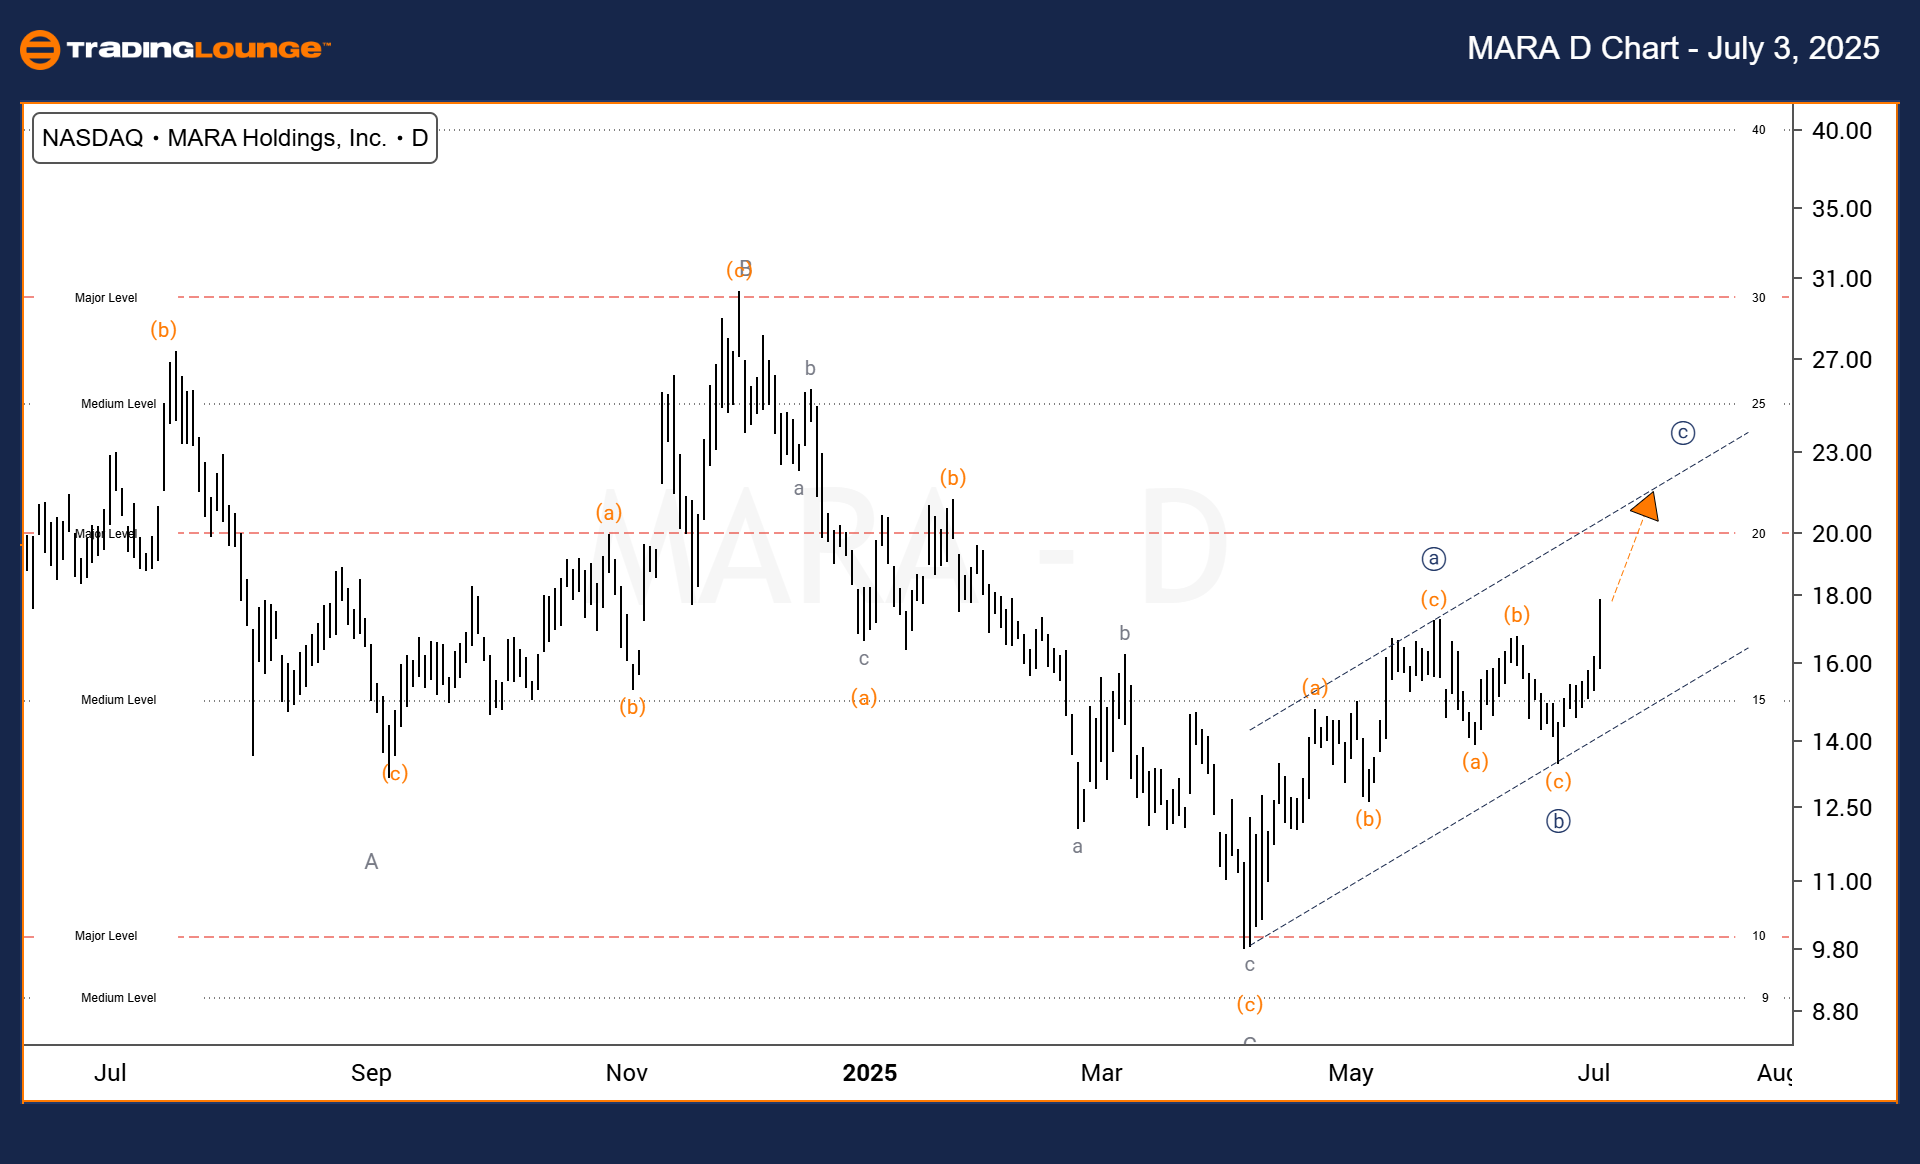
MARA Holdings, Inc (MARA) Elliott Wave Analysis (Daily Chart)

MARA Technical Analysis Overview – Trading Lounge

MARA Holdings, Inc (MARA) Elliott Wave Technical Analysis 

Function: Trend

Mode: Corrective

Structure: Corrective

Position: Wave (a) of ©

Direction: Upside in Wave (a)

Details: Anticipating upward movement to $20, followed by $23 – signalling potential completion of Wave (a)

MARA Daily Chart Analysis

MARA Holdings, Inc (NASDAQ: MARA) appears to be in the final leg of Wave (a) within a broader Elliott Wave corrective pattern labeled ©. Current technical indicators suggest bullish momentum aiming for the $20 resistance level, with further extension to $23. This development would indicate the completion of the first phase of the correction. Once Wave (a) is finalized, traders should prepare for Wave (b), which may present short-term trading opportunities in the ongoing correction.

MARA-us-D-Chart-0307...


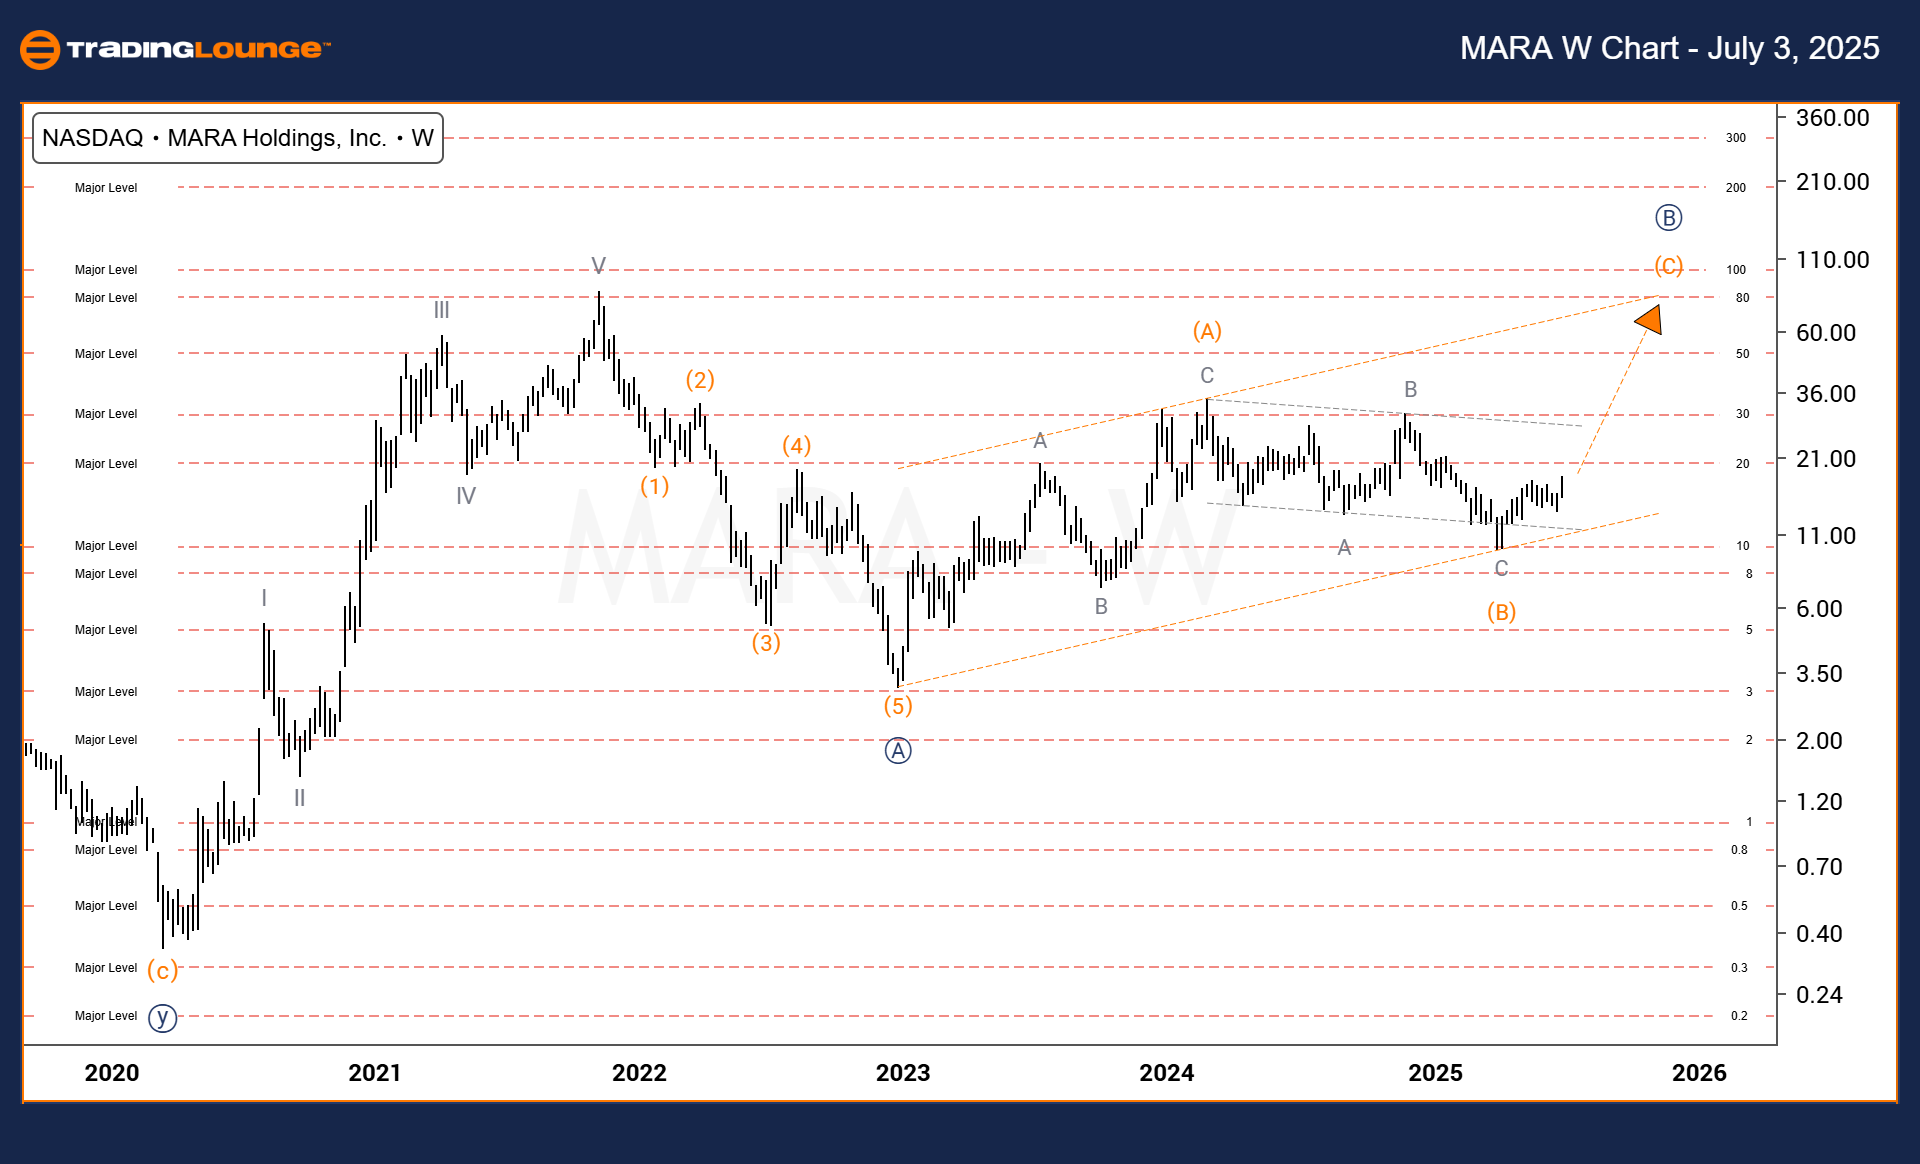
MARA Holdings, Inc (MARA) – Elliott Wave Analysis (Weekly Chart)

MARA Stock Technical Analysis Overview – Trading Lounge

Function: Counter Trend

Mode: Corrective

Structure: Corrective

Position: Wave (C) of Ⓑ

Direction: Upside into Wave (C)

Details: Wave (C) approaching key resistance along upper boundary of parallel channel

Weekly Chart Analysis

On the weekly timeframe, MARA Holdings, Inc (MARA) is advancing within a corrective phase identified as Wave (C) of Wave Ⓑ. The price action is nearing the upper resistance line of a defined parallel channel, indicating that Wave (C) is approaching maturity. While the broader movement remains bullish, this resistance zone could act as a turning point or consolidation area. Traders should watch for reactions around this level to evaluate short-term volatility and identify trading setups.

Technical Analyst: Dhiren Pahuja

Visit: TradingLounge.com for detailed analysis and market updates.

Previous: IonQ, Inc. (IONQ) Elliott Wave Technical Analysis

VALUE Offer - $1 for 2 Weeks then $29 a month!Click here

Access 7 Analysts Over 200 Markets Covered. Chat Room With Support

MARA-us-w-Chart-0307...

Related

In-Depth Elliott Wave Forecast and Technical Analysis for NAB on the Australian Stock Exchange (ASX)

In-Depth Elliott Wave Forecast and Technical Analysis for NAB on the Australian Stock Exchange (ASX)

Our comprehensive Elliott Wave analysis of ASX: NATIONAL AUSTRALIA BANK LIMITED (NAB) provides trade...

Read More >
NORTHERN STAR RESOURCES LTD – NST Elliott Wave Forecast Signals Bearish Trend, Targeting 16.86 with Full Technical Chart Insight

NORTHERN STAR RESOURCES LTD – NST Elliott Wave Forecast Signals Bearish Trend, Targeting 16.86 with Full Technical Chart Insight

ASX:NST is trending downward per Elliott Wave analysis, targeting 16.86. No bullish reversal signs a...

Read More >
KOSPI Composite Index Elliott Wave Technical Analysis: Indicates a Strong Bullish Trend with Significant Investment Potential

KOSPI Composite Index Elliott Wave Technical Analysis: Indicates a Strong Bullish Trend with Significant Investment Potential

The latest Elliott Wave analysis on the KOSPI Composite Index indicates a strong bullish trend with ...

Read More >
Vanguard Australian Shares Index V300AEQ ETF UNITS – VAS Stock Analysis & Elliott Wave Technical Forecast

Vanguard Australian Shares Index V300AEQ ETF UNITS – VAS Stock Analysis & Elliott Wave Technical Forecast

This article provides an in-depth Elliott Wave analysis of ASX: V300AEQ ETF Units – VAS, focusing o...

Read More >
The Home Depot (HD) Stocks Elliott Wave Technical Analysis: Focusing on its Bullish Momentum and Key Levels at $500 Target

The Home Depot (HD) Stocks Elliott Wave Technical Analysis: Focusing on its Bullish Momentum and Key Levels at $500 Target

This article provides an Elliott Wave analysis of The Home Depot (HD) stock, focusing on its bullish...

Read More >

$1 for 2 Weeks

then $29 a month!

What a Special Offer!

Trade Recommendations

Unleash the power of deversified trading with our comprehensive portfolio, covering 250+ markets:

  • Stock Trades
  • Crypto Trades
  • Forex Trades
  • Commodity Trades
Elliott Wave Analysis

Gain a competitive edge with expert insights and AI-powered Elliott Wave charting into:

  • Global Indices
  • US Stocks & ASX Stocks
  • Forex & Crypto
  • Commodities
Top-Notch Trading Tools

Equip yourself with the tools of success:

  • Real-time Chat rooms
  • Elliott Wave Algorithm
  • Portfolio tools
  • TradingLevels
  • Screener
  • Trading Game
7 Elliott Wave Analysts

Stay ahead of the market with daily charts and insightful videos
Your secret to strategic trading!

JOIN HERE


Welcome to TradingLounge (ASIC A.R.No. 321187), specialists in trades, trading education and technical analysis, covering stocks, indices, commodities, forex and cryptocurrencies.

When you join TradingLounge you have access to everything we offer, including trade tools, educational content and a social platform to chat with like-minded investors.

Read more

@Copyright 2024 by tradinglounge.com

Contact Us

Australian no: 02 4787 6020

International no: +61 (2) 47876020

Pay with:

Find us on