Vanguard Australian Shares Index V300AEQ ETF UNITS – (1D Chart)
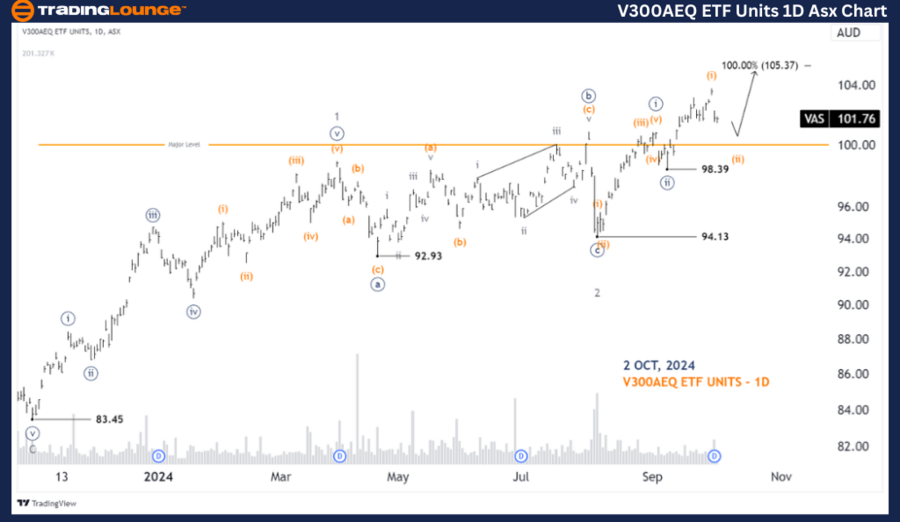
Greetings, in today's Elliott Wave analysis, we update the Australian Stock Exchange (ASX) regarding V300AEQ ETF UNITS – VAS. Our analysis suggests that VAS may have completed wave 2-grey, and wave 3-grey is now developing to push prices higher.
ASX: V300AEQ ETF UNITS – VAS 1D Chart (Semilog Scale) Analysis
VAS Elliott Wave Technical Analysis
Function: Major trend (Minor degree, grey)
Mode: Motive
Structure: Impulse
Position: Wave (ii)-orange of Wave ((iii))-navy of Wave 3-grey
Details:
- Wave (i)-orange has finished, and wave (ii)-orange is unfolding to push lower.
- Wave (iii)-orange is expected to push the price higher eventually.
Invalidation Point: 98.39

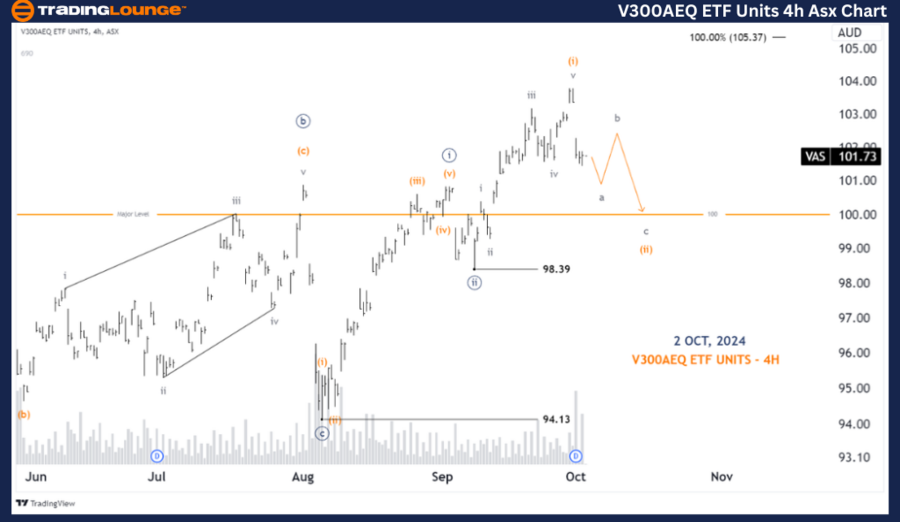
ASX: V300AEQ ETF UNITS – VAS 4-Hour Chart Analysis
ASX: Vanguard Australian Shares Index Elliott Wave Analysis
Function: Major trend (Minute degree, navy)
Mode: Motive
Structure: Impulse
Position: Wave (ii)-orange of Wave ((iii))-navy
Details:
- In the short term, wave (i)-orange has completed its five-wave structure, and wave (ii)-orange is now unfolding in a Zigzag pattern, pushing lower.
- Eventually, wave (iii)-orange is expected to push higher, continuing the overall upward trend.
Invalidation Point: 98.39
Technical Analyst: Hua (Shane) Cuong, CEWA-M (Master’s Designation).
Source: visit Tradinglounge.com and learn From the Experts Join TradingLounge Here
See Previous: Brambles Limited - BXB Elliott Wave Technical Analysis
VALUE Offer - Buy 1 Month & Get 3 Months!Click here
Access 7 Analysts Over 200 Markets Covered. Chat Room With Support

Conclusion:
This analysis provides a forecast of both long-term and short-term trends for ASX: V300AEQ ETF UNITS – VAS. By identifying critical price levels for validation or invalidation of our wave counts, we aim to give readers a clearer perspective on market movements. With these insights, traders can better align their strategies with market trends and make more informed decisions.