NEWS CORPORATION – NWS Elliott Wave Technical Analysis | TradingLounge
Overview:
Welcome to the latest Elliott Wave analysis for News Corporation (ASX:NWS). Based on current wave structures, NWS stock appears to be undergoing a corrective phase. These corrective movements often precede motive waves, pointing to potential upward trends ahead. This technical breakdown offers a focused look at wave positioning and key price levels in play.
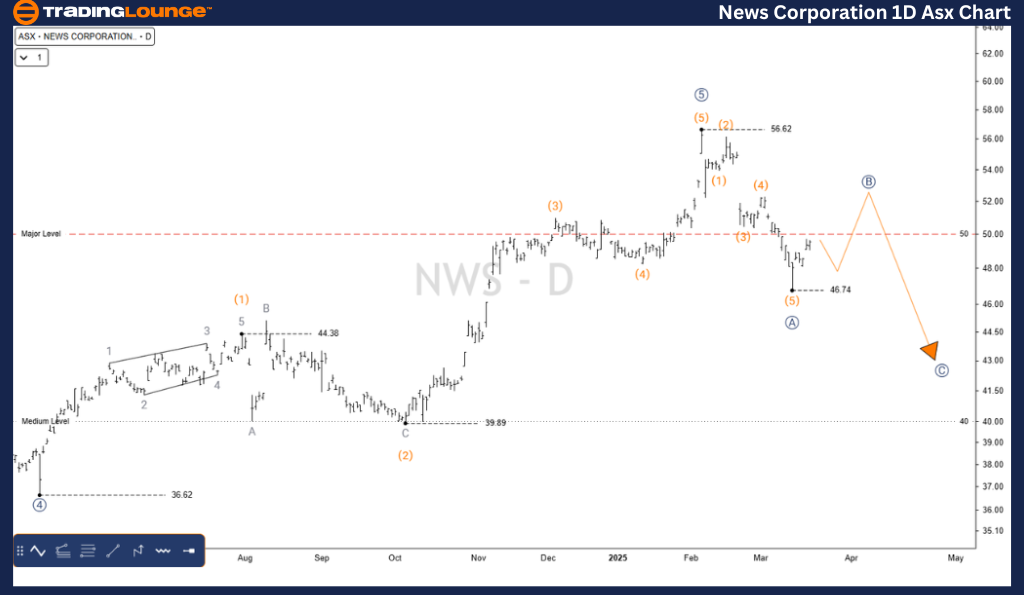
NWS – Elliott Wave Technical Analysis (1D Chart – Semilog Scale)
Function: Major Trend (Primary Degree, Navy)
Mode: Motive
Structure: Impulse
Position: Wave (A) – orange of Wave ((B)) – navy
Details:
A completed five-wave pattern recently peaked at $56.62, indicating the start of a corrective ABC structure at the navy degree. This current Elliott Wave correction may extend downward, with a price target around $39.89.
Invalidation Point: $56.62
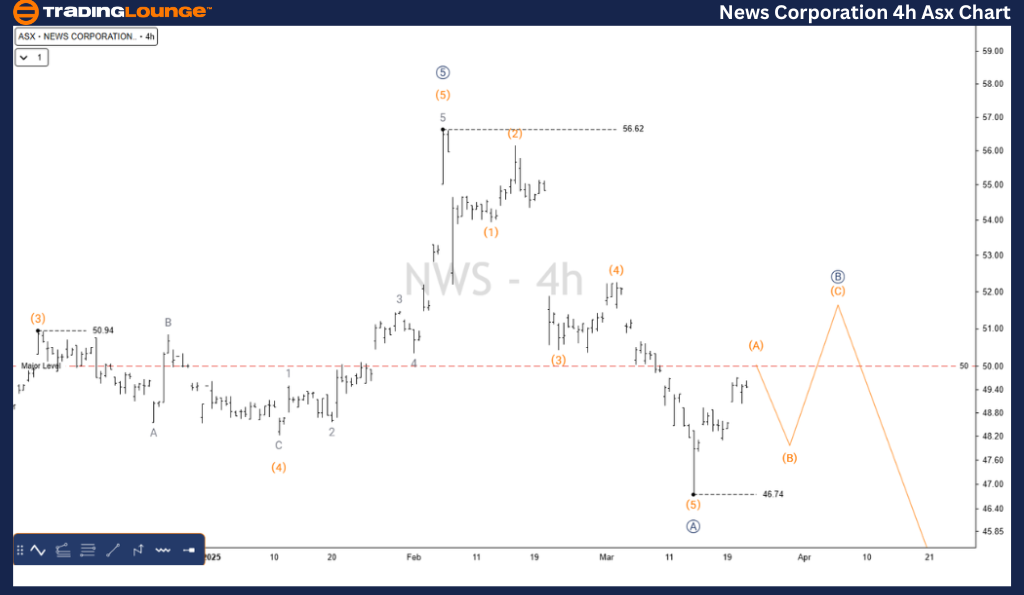
NWS – Elliott Wave Technical Analysis (4-Hour Chart)
Function: Major Trend (Minute Degree, Navy)
Mode: Motive
Structure: Impulse
Position: Wave (A) – orange of Wave ((B)) – navy
Details:
Following the $56.62 high, the navy ((A)) wave ended at $46.74. The ongoing navy ((B)) wave is taking shape as a Zigzag correction (A)(B)(C) in orange. A slight rally is being followed by expectations of a lower move in the final (C) leg.
Invalidation Point: $46.74
Technical Analyst: Hua (Shane) Cuong, CEWA-M (Master’s Designation).
Source: Visit Tradinglounge.com and learn from the Experts. Join TradingLounge Here
See Previous: Newmont Corporation (NEM) Elliott Wave Technical Analysis
VALUE Offer - Buy 1 Month & Get 3 Months!Click here
Access 7 Analysts Over 200 Markets Covered. Chat Room With Support
Conclusion:
This technical analysis for News Corporation (ASX:NWS) outlines both macro and micro Elliott Wave counts, aiming to enhance your ASX trading strategy. By identifying critical invalidation levels, we aim to improve forecast accuracy and help traders make informed decisions backed by structured wave theory.