Nestle India Stock Elliott Wave Analysis – TradingLounge (1D Chart)

NESTLE India Daily Chart Analysis

NESTLE India Elliott Wave Technical Analysis

Function: Larger Degree Trend Higher (Intermediate Degree, Orange)

Mode: Motive

Structure: Impulse

Position: Minute Wave ((iii)) Navy

Details: Minute Wave ((iii)) Navy is advancing within Minor Wave 5 Grey of Intermediate Wave (5) Orange. The stock is moving higher with a potential target towards 3050, against the 2450 level.

Invalidation Point: 2450

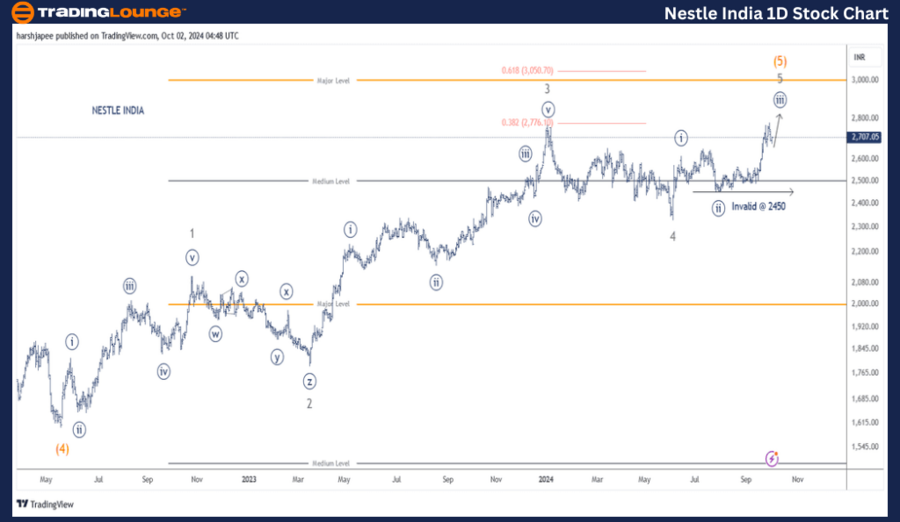
NESTLE India Daily Chart: Technical Analysis and Potential Elliott Wave Counts

The daily chart for NESTLE India is progressing upwards to conclude the fifth wave at various degrees, targeting 3050. The stock is currently subdividing within Minor Wave 5 Grey, and Minute Wave ((iii)) is set to push through the 2900 zone.

In May 2022, the stock hit a low of around 1600, marking the end of Intermediate Wave (4) Orange. Since then, the rally has formed five distinct Minor Waves, from 1 to 5, with the bulls currently in the final leg. The Minor Wave 4 low was registered on June 04, 2024, at 2330.

If this wave structure holds, the stock is now unfolding Minor Wave 5 and is currently within Minute Wave ((iii)) Navy. Prices should remain above the 2600 level to maintain the current impulse.

Nestle-India-1D-Stoc...


Nestle India Stock Technical Analysis – TradingLounge (4H Chart)

NESTLE INDIA – NESTLEIND Elliott Wave Analysis

Function: Larger Degree Trend Higher (Intermediate Degree, Orange)

Mode: Motive

Structure: Impulse

Position: Minute Wave ((iii)) Navy

Details: Minute Wave ((iii)) Navy is advancing within Minor Wave 5 Grey of Intermediate Wave (5) Orange. The potential target is near 3050, with Minuette Waves (i) through (v) Orange unfolding to complete Minute Wave ((iii)) Navy towards the 2910 level.

Invalidation Point: 2450

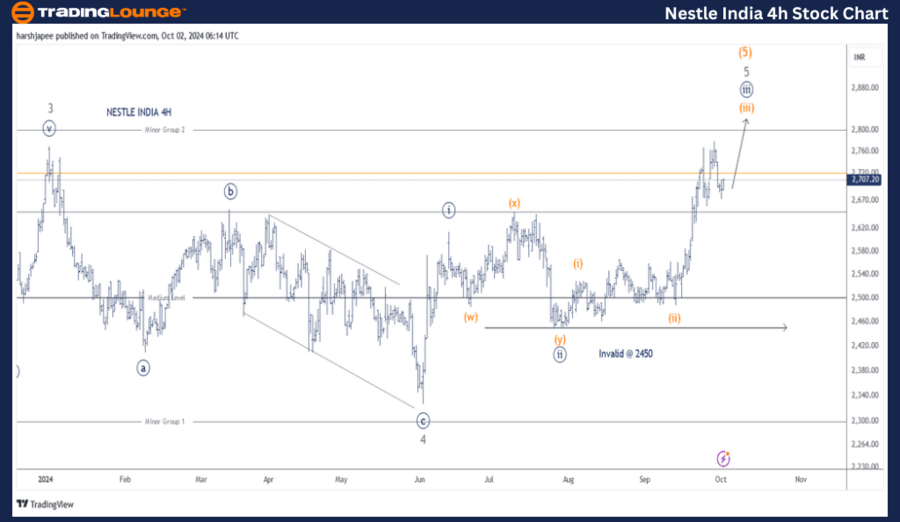
NESTLE India 4H Chart: Technical Analysis and Potential Elliott Wave Counts

The 4H chart for NESTLE India shows sub-waves within Minor Wave 4, moving between the 2770 and 2600 range, forming a potential zigzag at the Minute degree. Within Minor Wave 5, Minute Wave ((ii)) displayed a combination pattern. Recent price action suggests that Minute Wave ((iii)) is advancing towards the 2900-2910 zone, against the 2450 invalidation level.

Technical Analyst: Harsh Japee

Source: visit Tradinglounge.com and learn From the Experts Join TradingLounge Here 

Previous: HDFC Bank Elliott Wave Technical Analysis

VALUE Offer - Buy 1 Month & Get 3 Months!Click here

Access 7 Analysts Over 200 Markets Covered. Chat Room With Support

Nestle-India-4h-Stoc...


Conclusion:

NESTLE India is advancing towards the 3050 level as Minute Wave ((iii)) Navy unfolds within Minor Wave 5 Grey of Intermediate Wave (5) Orange. The key support level remains at 2450.

Related

CSX Stock Forecast Using Elliott Wave Points to Bullish Trend Continuation With Clear Target of $50 Amid Strong Momentum

CSX Stock Forecast Using Elliott Wave Points to Bullish Trend Continuation With Clear Target of $50 Amid Strong Momentum

Elliott Wave analysis shows CSX in a bullish impulsive phase. Wave 3 formation suggests strength, wi...

Read More >
Grasim Industries Stocks Elliott Wave Technical Analysis: Insights & Price Targets with Daily and 4H Chart Breakdowns

Grasim Industries Stocks Elliott Wave Technical Analysis: Insights & Price Targets with Daily and 4H Chart Breakdowns

Grasim Industries' Elliott Wave analysis reveals key technical patterns and stock predictions. E...

Read More >
Master Elliott Wave Analysis: Latest Trends in Commodities, Bonds, and USD DXY for Informed Trading

Master Elliott Wave Analysis: Latest Trends in Commodities, Bonds, and USD DXY for Informed Trading

Stay updated with our latest analysis on the commodities market, focusing on Elliott Wave trends. Ex...

Read More >
Explore the Best Trading Strategies for NIKKEI 225 Index with our Detailed N225 Elliott Wave Technical Analysis

Explore the Best Trading Strategies for NIKKEI 225 Index with our Detailed N225 Elliott Wave Technical Analysis

Unlock the latest insights into Nikkei 225 trading with our detailed Elliott Wave analysis. Whether ...

Read More >
NASDAQ Stock Market Update: Key Insights on AAPL, TSLA, AMZN, and More as Earnings Week Approaches

NASDAQ Stock Market Update: Key Insights on AAPL, TSLA, AMZN, and More as Earnings Week Approaches

The text provides an Elliott Wave analysis of the NASDAQ stock market, focusing on major indices lik...

Read More >
Learn how to navigate Dogecoin Crypto Market Trends: DOGEUSD Elliott Wave Technical Analysis

Learn how to navigate Dogecoin Crypto Market Trends: DOGEUSD Elliott Wave Technical Analysis

This article thoroughly analyses Dogecoin (DOGEUSD) using Elliott Wave theory. It includes detailed ...

Read More >

$1 for 2 Weeks

then $29 a month!

What a Special Offer!

Trade Recommendations

Unleash the power of deversified trading with our comprehensive portfolio, covering 250+ markets:

  • Stock Trades
  • Crypto Trades
  • Forex Trades
  • Commodity Trades
Elliott Wave Analysis

Gain a competitive edge with expert insights and AI-powered Elliott Wave charting into:

  • Global Indices
  • US Stocks & ASX Stocks
  • Forex & Crypto
  • Commodities
Top-Notch Trading Tools

Equip yourself with the tools of success:

  • Real-time Chat rooms
  • Elliott Wave Algorithm
  • Portfolio tools
  • TradingLevels
  • Screener
  • Trading Game
7 Elliott Wave Analysts

Stay ahead of the market with daily charts and insightful videos
Your secret to strategic trading!

JOIN HERE


Welcome to TradingLounge (ASIC A.R.No. 321187), specialists in trades, trading education and technical analysis, covering stocks, indices, commodities, forex and cryptocurrencies.

When you join TradingLounge you have access to everything we offer, including trade tools, educational content and a social platform to chat with like-minded investors.

Read more

@Copyright 2024 by tradinglounge.com

Contact Us

Australian no: 02 4787 6020

International no: +61 (2) 47876020

Pay with:

Find us on