Natural Gas Elliott Wave Analysis - prices approach key resistance zone

In the dynamic world of natural gas trading, Elliott Wave Theory offers invaluable insights into market trends and potential price movements. Currently, natural gas prices are on the verge of encountering a critical resistance zone, suggesting a compelling opportunity for traders and investors to strategize their positions. Let's delve into the Elliott Wave analysis to understand the unfolding market dynamics.

Trend Function: Impulsive

Trend Mode: Impulsive

Wave Structure: Impulse Wave

Position: Black wave 4 of red wave (3)

Direction: Black wave 5 of red wave (3)

Over the past couple of weeks, natural gas has exhibited an upward correction within its long-term bearish trend, which commenced back in August 2022 when prices hovered around the $10 mark. Despite this corrective move, the overarching bearish sentiment remains intact, suggesting further downside potential. The crucial question revolves around where this correction will culminate, with indications pointing towards significant price confluence zones depicted on the charts.

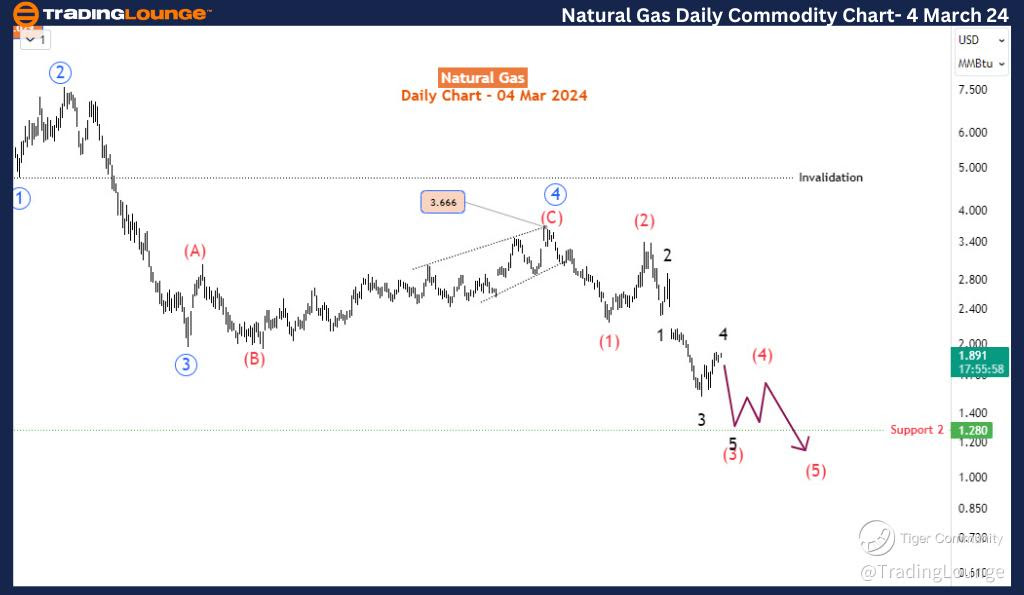
Natural Gas Day Chart Analysis

A glance at the daily chart reaffirms the prevailing bearish trend. The completion of the 4th wave (in blue) within the bearish impulse wave occurred at 3.666, signaling the initiation of the 5th wave. A closer examination reveals that blue wave 5 is in the process of finalizing the red sub-wave (3). As anticipated, the red wave (3) is unfolding into an impulse wave, with the current focus on completing its 4th sub-wave denoted by the black wave 4. Upon the conclusion of wave 4, a subsequent downward movement is anticipated for wave 5 of (3). From the daily chart perspective, it appears that the decline in natural gas since 2022 is nearing its culmination, with the potential to reach its lowest point in the forthcoming months. Meanwhile, scrutiny of the H4 chart provides insights into potential participation opportunities in the ensuing sell-off for wave 5 of (3).

Natural-Gas-day-comm...


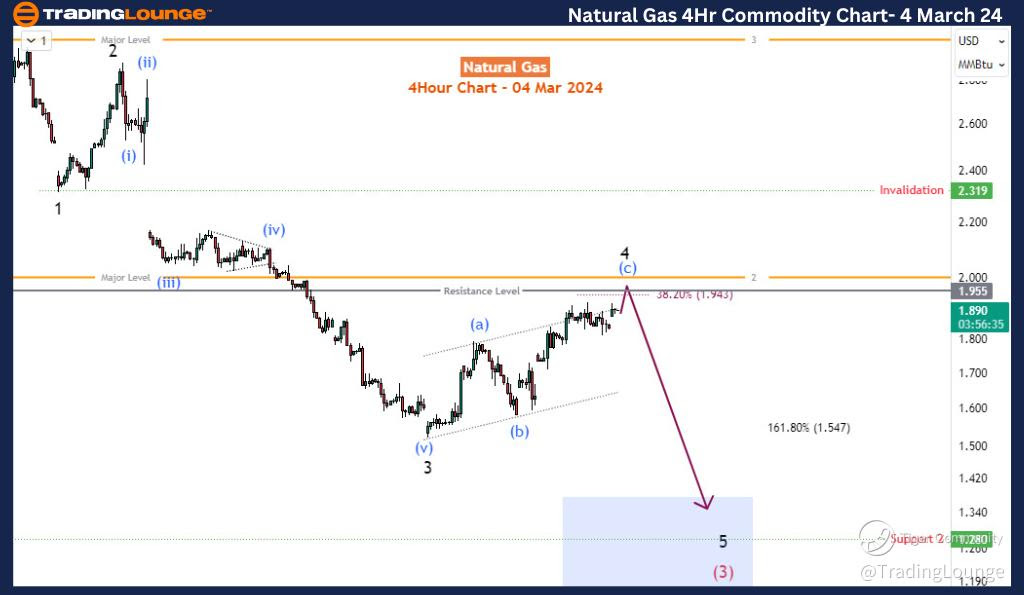
Natural Gas 4H Chart Analysis

On the H4 chart, wave 4 subdivides into a 3-wave correction, particularly the blue wave (a)-(b)-(c). An intriguing observation is the identification of a confluence zone within the range of 1.94-2, where psychological, Fibonacci and resistance levels converge, hinting at the possible termination of wave 4. The validity of the bearish impulse wave (3) could be compromised if the price surpasses the 2.32 threshold.

In summary, according to Elliott Wave Theory, the ongoing rebound in natural gas is categorized as a corrective move within a broader bearish impulse wave. As the price approaches a pivotal resistance zone, market participants can anticipate a resurgence of selling pressure, potentially propelling the commodity toward the 1.2 mark.

Technical Analyst: Sanmi Adeagbo

Source: visit Tradinglounge.com and learn From the Experts Join TradingLounge Here 

See Previous: Cocoa 

TradingLounge Once Off SPECIAL DEAL: Here > 1 month Get 3 months.   

Natural-Gas-4hr-comm...

Related

Silver (XAGUSD) Commodity Elliott Wave Analysis: Key Trading Opportunities and Technical Insights that Could Influence Silver Prices

Silver (XAGUSD) Commodity Elliott Wave Analysis: Key Trading Opportunities and Technical Insights that Could Influence Silver Prices

This article provides an in-depth Silver Elliott Wave analysis with a detailed price forecast for 20...

Read More >
Visa Inc. (V) Stock Elliott Wave Analysis: Bullish Trend Insights, Price Forecasts, Wave 5 Targets, and Key Support

Visa Inc. (V) Stock Elliott Wave Analysis: Bullish Trend Insights, Price Forecasts, Wave 5 Targets, and Key Support

Visa Inc. stock is currently navigating through Elliott Wave patterns, with Wave {ii} of 5 showing b...

Read More >
CAC 40 Elliott Wave Forecast Shows Bullish Trend and Trading Opportunities in France Stock Market on Daily and Weekly Charts

CAC 40 Elliott Wave Forecast Shows Bullish Trend and Trading Opportunities in France Stock Market on Daily and Weekly Charts

Explore bullish Elliott Wave setups on the CAC 40 with actionable insights on trend direction, wave ...

Read More >
Crypto Dogecoin market analysis:  DOGEUSD Price News Today Elliott Wave Technical Analysis

Crypto Dogecoin market analysis: DOGEUSD Price News Today Elliott Wave Technical Analysis

This article provides an in-depth DOGEUSD Elliott Wave analysis, focusing on Dogecoin's price tr...

Read More >
Learn About the ASX WBC Share Price Forecasts, and Technical Chart Updates For Westpac Banking Corporation Elliott Wave Analysis

Learn About the ASX WBC Share Price Forecasts, and Technical Chart Updates For Westpac Banking Corporation Elliott Wave Analysis

Our detailed Elliott Wave analysis will give valuable insights into ASX: Westpac Banking Corporation...

Read More >
GBPUSD Elliott Wave Forecast: Daily and 4-Hour Chart Analysis with Key Trading Levels, and Strategy Insights

GBPUSD Elliott Wave Forecast: Daily and 4-Hour Chart Analysis with Key Trading Levels, and Strategy Insights

Detailed GBPUSD Elliott Wave analysis for daily and 4-hour charts, showing corrective wave structure...

Read More >

$1 for 2 Weeks

then $29 a month!

What a Special Offer!

Trade Recommendations

Unleash the power of deversified trading with our comprehensive portfolio, covering 250+ markets:

  • Stock Trades
  • Crypto Trades
  • Forex Trades
  • Commodity Trades
Elliott Wave Analysis

Gain a competitive edge with expert insights and AI-powered Elliott Wave charting into:

  • Global Indices
  • US Stocks & ASX Stocks
  • Forex & Crypto
  • Commodities
Top-Notch Trading Tools

Equip yourself with the tools of success:

  • Real-time Chat rooms
  • Elliott Wave Algorithm
  • Portfolio tools
  • TradingLevels
  • Screener
  • Trading Game
7 Elliott Wave Analysts

Stay ahead of the market with daily charts and insightful videos
Your secret to strategic trading!

JOIN HERE


Welcome to TradingLounge (ASIC A.R.No. 321187), specialists in trades, trading education and technical analysis, covering stocks, indices, commodities, forex and cryptocurrencies.

When you join TradingLounge you have access to everything we offer, including trade tools, educational content and a social platform to chat with like-minded investors.

Read more

@Copyright 2024 by tradinglounge.com

Contact Us

Australian no: 02 4787 6020

International no: +61 (2) 47876020

Pay with:

Find us on