Silver (XAGUSD) Commodity Elliott Wave Technical Analysis
Silver has reached a new high in 2024 after a significant breakout following the pullback in early October. The metal is positioned for further gains, potentially pushing toward the $40 range in the coming weeks. Dips are expected to continue offering opportunities for buyers to drive prices higher.
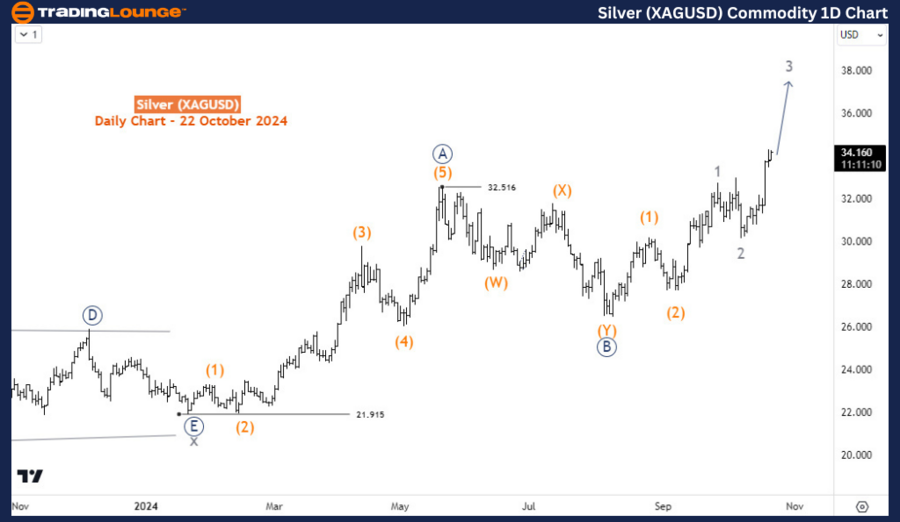
Silver XAGUSD Daily Chart Overview
The current bullish trend began in January 2024, after Silver exited a prolonged sideways accumulation phase that lasted throughout 2023. The bullish cycle starting in 2024 could unfold as either a 3-wave or a 5-wave structure. In either scenario, Silver is expected to reach at least the $37-$41 range. If the price surpasses the $41-$43 zone, it would confirm that the current rally from January 2024 is an impulsive 5-wave structure, rather than a 3-wave. Both potential scenarios suggest more upward movement in the coming weeks. Currently, Silver appears to be in wave 3 of (3). Once wave 3 completes, a pullback for wave 4 is likely, providing a new buying opportunity. In the meantime, traders may continue to trade wave 3, which remains incomplete.

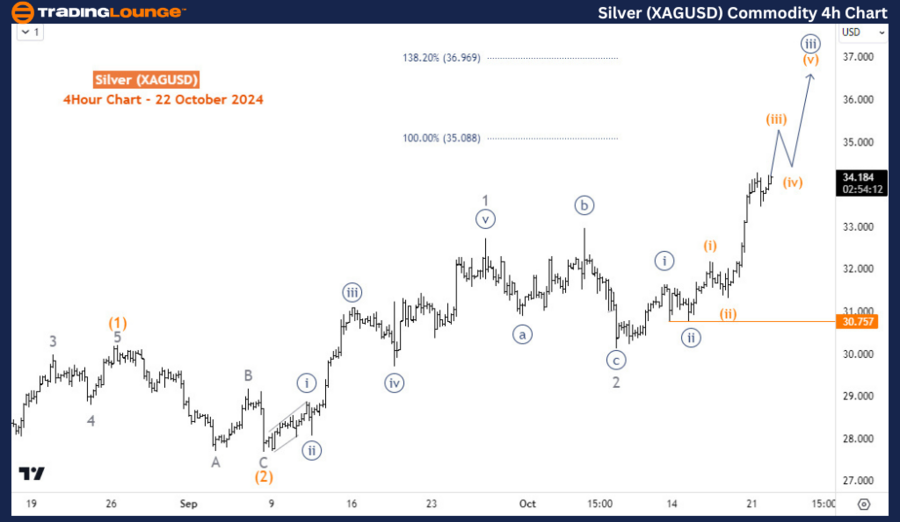
Silver XAGUSD H4 Chart Insight
On the 4-hour chart, Silver seems to be in wave ((iii)) of 3. After wave ((iii)) concludes, wave ((iv)) will present a minor dip, offering buyers a chance to enter again during the broader wave 3 trend. However, if the next pullback turns out to be deeper, it could represent wave ((ii)) of 3, signaling an extended wave 3 and more profit potential for buyers. Traders should stay alert for pullbacks and consider buying at potential pivot lows.
Technical Analyst: Sanmi Adeagbo
Source: visit Tradinglounge.com and learn From the Experts Join TradingLounge Here
See Previous: Coffee Elliott Wave Technical Analysis
VALUE Offer - Buy 1 Month & Get 3 Months!Click here
Access 7 Analysts Over 200 Markets Covered. Chat Room With Support
