28Jan

Fortinet Inc. (FTNT) Stocks Elliott Wave Technical Analysis: Covering Daily Chart and 1-hour Chart, Indicating a Bullish Trend

Elliott Wave Analysis: Fortinet Inc. (FTNT)

In this Elliott Wave analysis, we examine Fortinet Inc. (FTNT) using daily and 1-hour charts to evaluate the current wave position and forecast potential price movements.


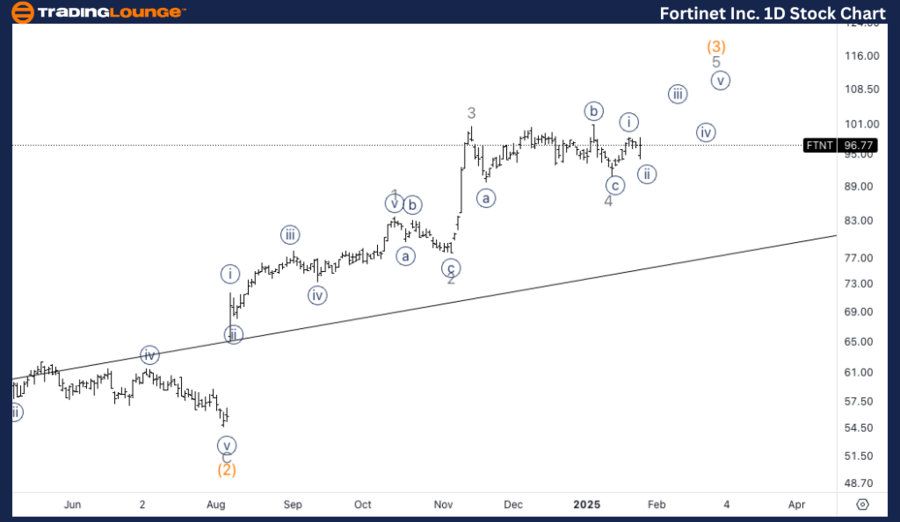
FTNT Elliott Wave Analysis – TradingLounge Daily Chart

Fortinet Inc. (FTNT) Daily Chart Analysis

FTNT Elliott Wave Technical Analysis Overview:

Function: Trend

Mode: Impulsive

Structure: Motive

Position: Wave 5 of (3)

Direction: Upside in wave 5

Details: The analysis indicates continued upside momentum into wave 5 of (3). Given that Wave 3 was shorter than Wave 1, we expect Wave 5 to be shorter than wave 3. Alternatively, if wave (3) has already completed, the stock may be entering the early stages of wave (4), a potential corrective phase before resuming its upward trend.

Key Takeaways:

  • Wave Projection: Anticipating further upside into wave 5 of (3).
  • Alternative Count: Suggests wave (3) is complete, and wave (4) could initiate.
  • Potential Implications: Corrective move in wave (4) may precede further bullish momentum.

Fortinet-Inc-1D-Stoc...


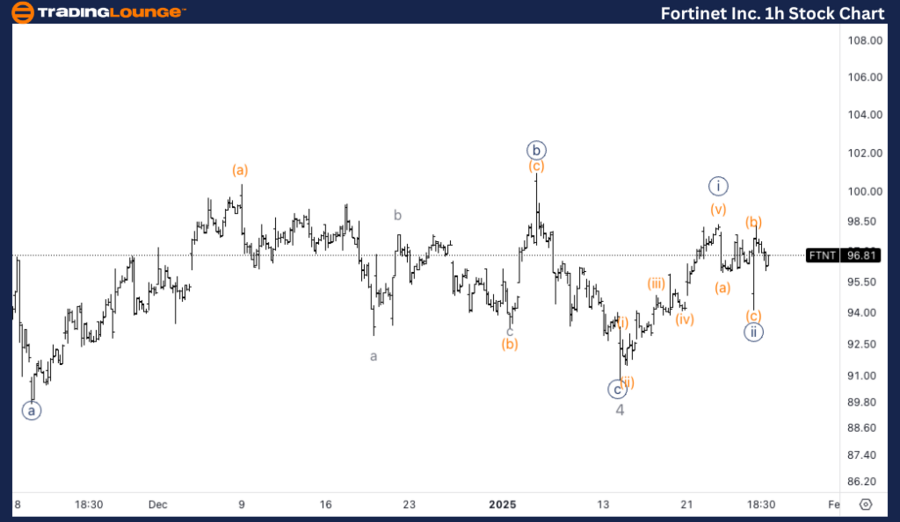
FTNT Elliott Wave Analysis – TradingLounge 1-Hour Chart

Fortinet Inc. (FTNT) Stock Analysis – 1-Hour Chart

Fortinet Inc Stock Technical Analysis Overview:

Function: Trend

Mode: Impulsive

Structure: Motive

Position: Wave {iii} of 5

Direction: Upside in wave {iii}

Details: On the 1-hour chart, Fortinet appears poised for further bullish movement in wave {iii} of 5. A visible three-wave pattern in what could be wave {ii} of 5 indicates that wave {iii} is likely to commence, suggesting a continuation of upward momentum.

Key Takeaways:

  • Wave {iii} Formation: Indications of a completed wave {ii}, paving the way for wave {iii}.
  • Bullish Outlook: Further upside expected as wave {iii} develops.
  • Short-Term Trend: Momentum aligns with higher timeframes, supporting an overall bullish bias.

Technical Analyst: Alessio Barretta

Source: visit Tradinglounge.com and learn From the Experts Join TradingLounge Here 

See Previous: Alphabet Inc. (GOOGL) Elliott Wave Technical Analysis

VALUE Offer - Buy 1 Month & Get 3 Months!Click here

Access 7 Analysts Over 200 Markets Covered. Chat Room With Support

Fortinet-Inc-1h-Stoc...


Summary

Fortinet Inc. (FTNT) demonstrates a bullish Elliott Wave structure on both daily and 1-hour charts. The stock is likely to continue its upward momentum in wave 5 of (3) on the daily chart, with potential corrections aligning with wave (4). On the 1-hour chart, FTNT signals the start of wave {iii} of 5, highlighting further bullish possibilities. Investors should monitor wave formations for confirmation of these projections.

Related

Copper Commodity Elliott Wave Technical Analysis: Market Trends, Forecasts, and Trading Strategies

Copper Commodity Elliott Wave Technical Analysis: Market Trends, Forecasts, and Trading Strategies

Get the latest copper prices and in-depth Elliott Wave analysis. Our article covers copper market tr...

Read More >
AAPL Stock Analysis: Apple Inc.(AAPL) Elliott Wave Technical Analysis, Stock price predictions, and news updates.

AAPL Stock Analysis: Apple Inc.(AAPL) Elliott Wave Technical Analysis, Stock price predictions, and news updates.

Apple Inc. (AAPL) Elliott Wave Technical Analysis 5 March 24, Explore the latest AAPL stock analysis...

Read More >
In-Depth ASX Trading Success: COLES GROUP LIMITED. – COL Stock Analysis & Elliott Wave Technical Forecast

In-Depth ASX Trading Success: COLES GROUP LIMITED. – COL Stock Analysis & Elliott Wave Technical Forecast

This article provides an in-depth Elliott Wave analysis of Coles Group Limited (COL) listed on the A...

Read More >
GBPUSD Elliott Wave Analysis: Current Trends, Bullish Transition, Invalidation Levels, and Actionable Trading Insights

GBPUSD Elliott Wave Analysis: Current Trends, Bullish Transition, Invalidation Levels, and Actionable Trading Insights

GBPUSD using Elliott Wave principles, featuring insights into current wave structures, invalidation ...

Read More >
AAVE Price Forecast: Elliott Wave Signals Wave V Drop, Key Fibonacci Levels, and Smart Trading Strategy for Crypto Short Setups

AAVE Price Forecast: Elliott Wave Signals Wave V Drop, Key Fibonacci Levels, and Smart Trading Strategy for Crypto Short Setups

This analysis provides a detailed Elliott Wave breakdown of AAVE/USD, highlighting current market st...

Read More >

$1 for 2 Weeks

then $29 a month!

What a Special Offer!

Trade Recommendations

Unleash the power of deversified trading with our comprehensive portfolio, covering 250+ markets:

  • Stock Trades
  • Crypto Trades
  • Forex Trades
  • Commodity Trades
Elliott Wave Analysis

Gain a competitive edge with expert insights and AI-powered Elliott Wave charting into:

  • Global Indices
  • US Stocks & ASX Stocks
  • Forex & Crypto
  • Commodities
Top-Notch Trading Tools

Equip yourself with the tools of success:

  • Real-time Chat rooms
  • Elliott Wave Algorithm
  • Portfolio tools
  • TradingLevels
  • Screener
  • Trading Game
7 Elliott Wave Analysts

Stay ahead of the market with daily charts and insightful videos
Your secret to strategic trading!

JOIN HERE


Welcome to TradingLounge (ASIC A.R.No. 321187), specialists in trades, trading education and technical analysis, covering stocks, indices, commodities, forex and cryptocurrencies.

When you join TradingLounge you have access to everything we offer, including trade tools, educational content and a social platform to chat with like-minded investors.

Read more

@Copyright 2024 by tradinglounge.com

Contact Us

Australian no: 02 4787 6020

International no: +61 (2) 47876020

Pay with:

Find us on