13May

Coal India Ltd. (COALINDIA) Stock Analysis: Unveiling Elliott Wave Patterns and Predicting Future Price Movements for Strategic Trading Decisions

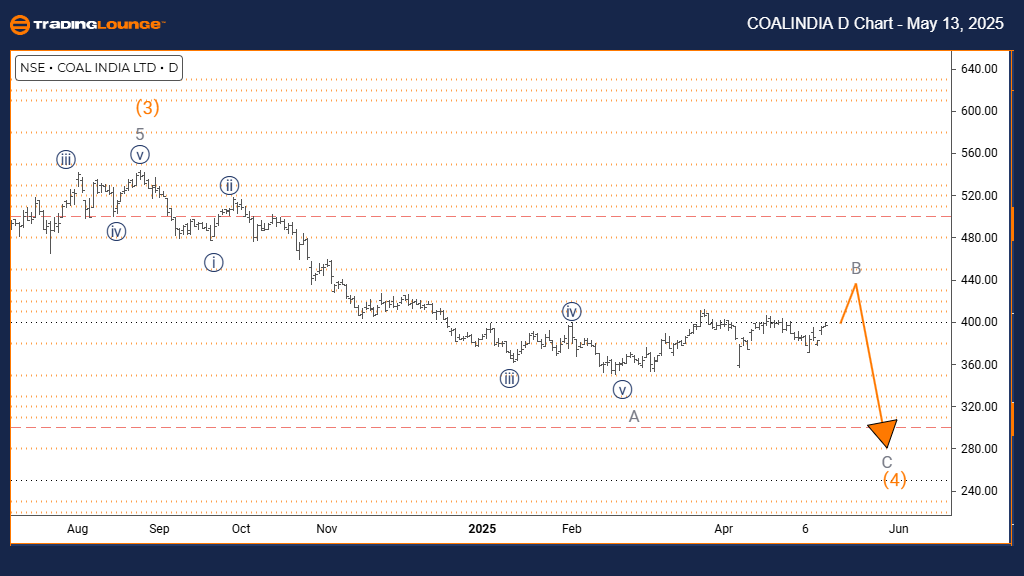
COAL INDIA Elliott Wave Analysis | Trading Lounge Daily Chart

COAL INDIA Elliott Wave Technical Outlook

FUNCTION: Counter Trend

MODE: Corrective

STRUCTURE: Gray Wave B

POSITION: Orange Wave 4

DIRECTION NEXT LOWER DEGREES: Gray Wave C

DETAILS: Completion of gray wave A; gray wave B of wave 4 now unfolding.

The daily Elliott Wave analysis for Coal India stock indicates a counter-trend corrective formation. The pattern currently reveals gray wave B forming within orange wave 4, confirming that gray wave A has ended. This transition introduces a short-term bullish correction.

The ongoing retracement, defined as gray wave B, suggests a corrective rally that may precede a decline toward gray wave C. The chart structure supports the notion that gray wave A is complete and gray wave B is progressing. This implies a likely bearish move in gray wave C after the corrective bounce finalizes. Since wave B movements often have constrained upside potential, traders should be cautious unless key resistance zones are breached.

This setup provides key insights into Coal India's corrective cycle, emphasizing heightened volatility during gray wave B’s development. Monitoring this phase is crucial, as its end could trigger the start of gray wave C. The analysis identifies a short-term bullish phase within a broader downward correction, supporting a bearish continuation once the current correction ends.

COALINDIA-d-indian-s...


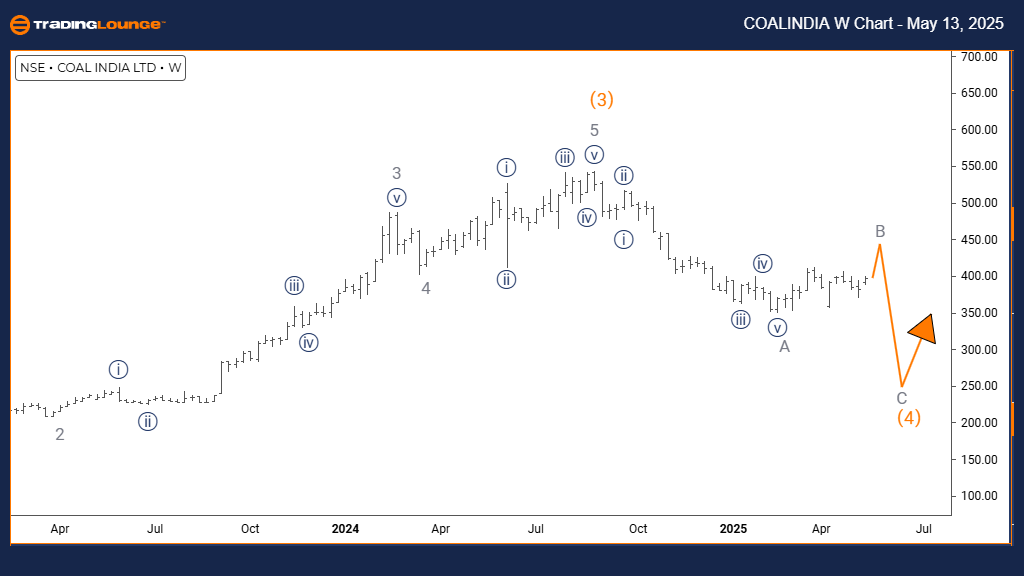
COAL INDIA Elliott Wave Analysis | Trading Lounge Weekly Chart

COAL INDIA Elliott Wave Technical Outlook

FUNCTION: Counter Trend

MODE: Corrective

STRUCTURE: Orange Wave 4

POSITION: Navy Blue Wave 1

DIRECTION NEXT HIGHER DEGREES: Orange Wave 5

DETAILS: Completion of orange wave 3; orange wave 4 in progress.

The weekly Elliott Wave analysis for Coal India Limited points to a corrective phase developing as part of a long-term bullish trend. After the confirmed completion of orange wave 3, the market has entered orange wave 4, currently forming within navy blue wave 1. This configuration represents a short-term correction rather than a full trend reversal.

Corrections in wave 4 often involve sideways or slightly declining price movements before a resumption of upward momentum through orange wave 5. The analysis underlines that orange wave 3 has finalized, transitioning into the current pullback. Traders should focus on Fibonacci retracement levels to gauge the correction’s boundary before anticipating another bullish push.

This broader technical view suggests that the current pullback could offer a strategic entry for long positions ahead of wave 5. The limited downside risk during wave 4 enhances the bullish outlook, assuming the corrective phase aligns with typical wave behavior. Close observation will help traders position ahead of the potential rally, aligning with the prevailing uptrend in Coal India’s share price.

Technical Analyst: Malik Awais

Source: Visit Tradinglounge.com and learn from the Experts. Join TradingLounge Here 

Previous: ADANI ENTERPRISES Elliott Wave Technical Analysis

VALUE Offer - Buy 1 Month & Get 3 Months!Click here

Access 7 Analysts Over 200 Markets Covered. Chat Room With Support

COALINDIA-4h-indian-...

Related

Advanced Micro Devices Inc. (AMD) Elliott Wave Technical Analysis Provides Traders with Valuable insights into AMD's price movements

Advanced Micro Devices Inc. (AMD) Elliott Wave Technical Analysis Provides Traders with Valuable insights into AMD's price movements

Our detailed Elliott Wave analysis for Advanced Micro Devices Inc. (AMD) provides traders with valua...

Read More >
British Pound/Japanese Yen(GBPJPY) Forex Elliott Wave Technical Analysis

British Pound/Japanese Yen(GBPJPY) Forex Elliott Wave Technical Analysis

The GBPJPY Elliott Wave Analysis, through its meticulous examination of both daily and 4-hour charts...

Read More >
Elliott Wave Technical Analysis and Trading Strategies: S&P 500, NASDAQ 100, DAX 40, FTSE 100, ASX 200

Elliott Wave Technical Analysis and Trading Strategies: S&P 500, NASDAQ 100, DAX 40, FTSE 100, ASX 200

he document provides an in-depth Elliott Wave analysis of major global indices, including the S&P 50...

Read More >
QUALCOMM Inc. (QCOM) Stocks Elliott Wave Technical Analysis Covers Insights from both the daily and 4-hour charts

QUALCOMM Inc. (QCOM) Stocks Elliott Wave Technical Analysis Covers Insights from both the daily and 4-hour charts

Explore our comprehensive Elliott Wave analysis for QUALCOMM Inc. (QCOM) as of June 12, 2024. This i...

Read More >
Unlocking ASX Trading Success: TRANSURBAN GROUP – TCL Stock Analysis & Elliott Wave Technical Forecast

Unlocking ASX Trading Success: TRANSURBAN GROUP – TCL Stock Analysis & Elliott Wave Technical Forecast

The Transurban Group's stock performance (TCL) on the ASX through the lens of Elliott Wave theor...

Read More >
Expert Guidance on CSL Limited ASX Stock with key Price Points and Forecasted Movements: CSL Elliott Wave Analysis

Expert Guidance on CSL Limited ASX Stock with key Price Points and Forecasted Movements: CSL Elliott Wave Analysis

This article provides an in-depth Elliott Wave analysis of CSL Limited (ASX: CSL), offering valuable...

Read More >

$1 for 2 Weeks

then $29 a month!

What a Special Offer!

Trade Recommendations

Unleash the power of deversified trading with our comprehensive portfolio, covering 250+ markets:

  • Stock Trades
  • Crypto Trades
  • Forex Trades
  • Commodity Trades
Elliott Wave Analysis

Gain a competitive edge with expert insights and AI-powered Elliott Wave charting into:

  • Global Indices
  • US Stocks & ASX Stocks
  • Forex & Crypto
  • Commodities
Top-Notch Trading Tools

Equip yourself with the tools of success:

  • Real-time Chat rooms
  • Elliott Wave Algorithm
  • Portfolio tools
  • TradingLevels
  • Screener
  • Trading Game
7 Elliott Wave Analysts

Stay ahead of the market with daily charts and insightful videos
Your secret to strategic trading!

JOIN HERE


Welcome to TradingLounge (ASIC A.R.No. 321187), specialists in trades, trading education and technical analysis, covering stocks, indices, commodities, forex and cryptocurrencies.

When you join TradingLounge you have access to everything we offer, including trade tools, educational content and a social platform to chat with like-minded investors.

Read more

@Copyright 2024 by tradinglounge.com

Contact Us

Australian no: 02 4787 6020

International no: +61 (2) 47876020

Pay with:

Find us on