12Nov

Eicher Motors Elliott Wave Technical Insights: Navigating Bearish Trends and Market Forecasts

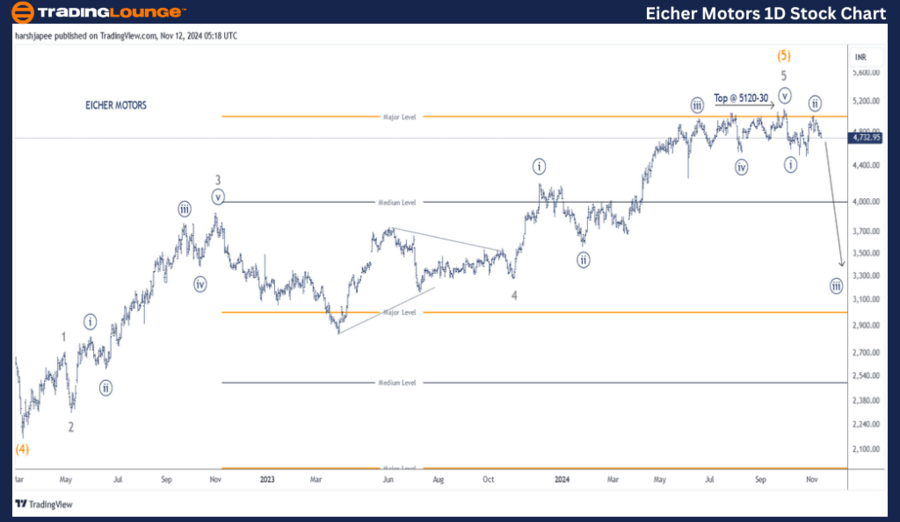
EICHER MOTORS – EICHERMOT Elliott Wave Technical Analysis (1D Chart)

EICHERMOT Elliott Wave Technical Analysis

Function: Counter Trend (Minute Degree, Orange)

Mode: Corrective

Structure: Impulse with Larger Degree Correction

Position: Minute Wave ((ii)) Navy

Details:

  • The structure appears to have turned lower against the 5120-30 high, signaling potential Intermediate Wave (5) termination.
  • Minute Wave ((i)) has completed its first impulse drop, and Minute Wave ((ii)) looks to be finished as prices turn lower from the 5010 level.
  • Minute Wave ((iii)) is likely in progress.

Invalidation Point: 5120

EICHER MOTORS Daily Chart Technical Analysis and Elliott Wave Counts

  • The daily chart indicates a larger degree uptrend that likely terminated in the 5120-30 range, marking Intermediate Wave (5) Orange as complete.
  • The stock has turned lower, carving out Minute Waves ((i)) and ((ii)) around 4536 and 5010 levels, respectively.
  • Earlier, in March 2022, the stock dropped to 2175 lows, completing Intermediate Wave (4) Orange. The subsequent rally subdivided into five Minor Waves (1 to 5) clearly visible on the chart.

If this wave structure holds true, EICHER MOTORS has concluded its larger degree uptrend around the 5120-30 range and entered a bearish phase, with bears maintaining control over the current price action.

EICHER-MOTORS-1d-sto...


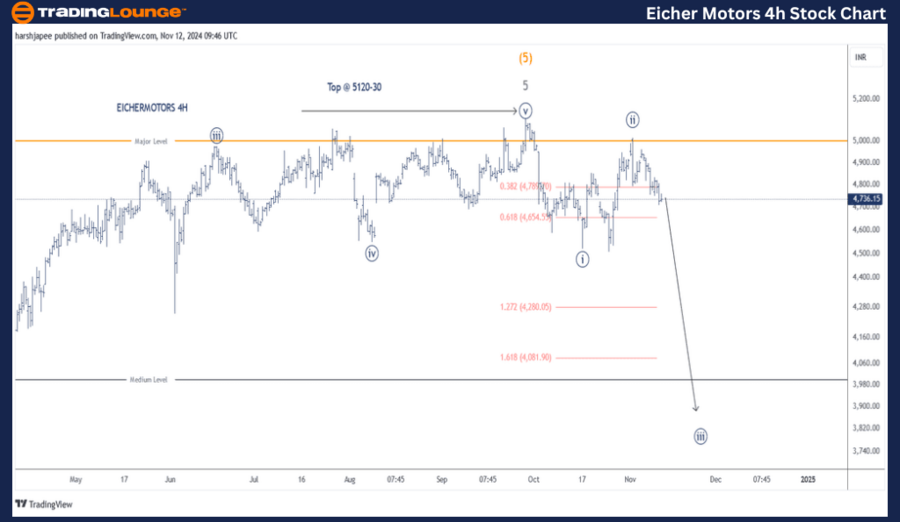
EICHER MOTORS – EICHERMOT Elliott Wave Technical Analysis (4H Chart)

Function: Counter Trend (Minute Degree, Orange)

Mode: Corrective

Structure: Impulse with Larger Degree Correction

Position: Minute Wave ((ii)) Navy

Details:

  • The structure likely turned lower after hitting the 5120-30 high, which aligns with the potential termination of Intermediate Wave (5) Orange.
  • Minute Wave ((i)) is completed around the 4536 level, followed by an expanded flat Minute Wave ((ii)) near 5010.
  • Minute Wave ((iii)) appears to be underway and pulling prices lower.

Invalidation Point: 5120

EICHER MOTORS 4H Chart Technical Analysis and Elliott Wave Counts

  • The 4H chart reveals lower-degree wave counts following highs around the 5120 level, marking a likely Intermediate Wave (5) Orange termination.
  • Minute Wave ((i)) carved out at 4536, followed by an expanded flat correction to Minute Wave ((ii)) at 5010.
  • If accurate, Minute Wave ((iii)) is actively dragging prices downward, signaling further bearish momentum.

Technical Analyst: Harsh Japee

Source: visit Tradinglounge.com and learn From the Experts Join TradingLounge Here 

Previous: ADANIPORTS Elliott Wave Technical Analysis 

VALUE Offer - Buy 1 Month & Get 3 Months!Click here

Access 7 Analysts Over 200 Markets Covered. Chat Room With Support

EICHER-MOTORS-4h-sto...


Conclusion:

EICHER MOTORS is likely declining within Minute Wave ((iii)), maintaining a bearish stance as long as prices stay below the 5120-30 range.

Related

Dogecoin Price Forecast: Elliott Wave Technical Analysis, MA200 Uptrend Insights, Wave V Targets, and Strategic Trading Tips

Dogecoin Price Forecast: Elliott Wave Technical Analysis, MA200 Uptrend Insights, Wave V Targets, and Strategic Trading Tips

Dogecoin price prediction using Elliott Wave technical analysis discovers trading strategies, Wave V...

Read More >
Stocks Bullish Trend: AAPL, AMZN, NVDA, TSLA, GOOGL, META, NFLX, MSFT, Elliott Wave Analysis

Stocks Bullish Trend: AAPL, AMZN, NVDA, TSLA, GOOGL, META, NFLX, MSFT, Elliott Wave Analysis

Explore the latest Commodities Market Technical Analysis, focusing on Bitcoin's potential ascent...

Read More >
GBPAUD Elliott Wave Analysis: Daily Wave 2 Correction & 4‑Hour Wave B Retracement Ahead of Potential Forecasted Breakouts

GBPAUD Elliott Wave Analysis: Daily Wave 2 Correction & 4‑Hour Wave B Retracement Ahead of Potential Forecasted Breakouts

GBPAUD Elliott Wave analysis reveals ongoing corrective waves on both daily (navy blue wave 2 withi...

Read More >
WTI Crude Oil Price Outlook: Elliott Wave Analysis Predicts $50 Target as Bearish Trend Holds Below $72 Resistance Level

WTI Crude Oil Price Outlook: Elliott Wave Analysis Predicts $50 Target as Bearish Trend Holds Below $72 Resistance Level

WTI crude oil continues a bearish Elliott Wave correction. Resistance at $72 limits gains, with down...

Read More >
"Elliott Wave Analysis of Key Indices: S&P 500, NASDAQ 100, Russell 2000, DJI, DAX 40, FTSE 100, ASX 200, and Nikkei"

"Elliott Wave Analysis of Key Indices: S&P 500, NASDAQ 100, Russell 2000, DJI, DAX 40, FTSE 100, ASX 200, and Nikkei"

"Delve into our detailed Elliott Wave Analysis of the Stock Market, focusing on key indices i...

Read More >

$1 for 2 Weeks

then $29 a month!

What a Special Offer!

Trade Recommendations

Unleash the power of deversified trading with our comprehensive portfolio, covering 250+ markets:

  • Stock Trades
  • Crypto Trades
  • Forex Trades
  • Commodity Trades
Elliott Wave Analysis

Gain a competitive edge with expert insights and AI-powered Elliott Wave charting into:

  • Global Indices
  • US Stocks & ASX Stocks
  • Forex & Crypto
  • Commodities
Top-Notch Trading Tools

Equip yourself with the tools of success:

  • Real-time Chat rooms
  • Elliott Wave Algorithm
  • Portfolio tools
  • TradingLevels
  • Screener
  • Trading Game
7 Elliott Wave Analysts

Stay ahead of the market with daily charts and insightful videos
Your secret to strategic trading!

JOIN HERE


Welcome to TradingLounge (ASIC A.R.No. 321187), specialists in trades, trading education and technical analysis, covering stocks, indices, commodities, forex and cryptocurrencies.

When you join TradingLounge you have access to everything we offer, including trade tools, educational content and a social platform to chat with like-minded investors.

Read more

@Copyright 2024 by tradinglounge.com

Contact Us

Australian no: 02 4787 6020

International no: +61 (2) 47876020

Pay with:

Find us on