ADANI PORTS and SEZ – ADANIPORTS Elliott Wave Analysis (1D Chart)

ADANIPORTS Elliott Wave Technical Analysis

Function: Larger Degree Trend Higher (Intermediate degree, orange)

Mode: Motive

Structure: Impulse

Position: Minor Wave 5 Grey

Details:

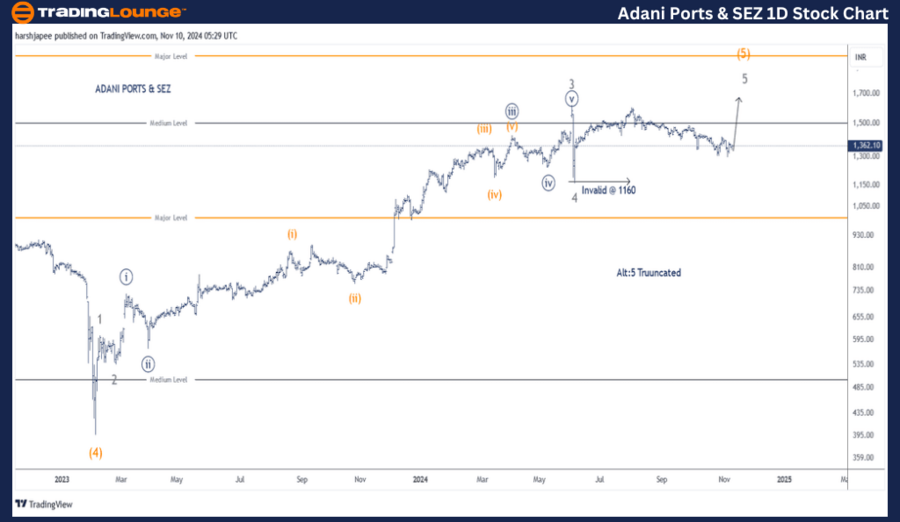
  • Minor Wave 5 Grey is advancing within Intermediate Wave (5) Orange, moving higher above the 1160 mark.
  • Alternatively, Minor Wave 5 Grey might have already ended near 1630 (truncation), leading to a downward trend.

Invalidation Point: 1160

ADANI PORTS & SEZ Daily Chart Technical Analysis and Potential Elliott Wave Counts:

The daily chart for ADANI PORTS & SEZ reflects a continued rally. The stock is currently in Minor Wave 5 of Intermediate Wave (5) Orange, with a potential to break the 1600 level. The crucial support for maintaining the bullish momentum is the 1160 low, marking the end of Minor Wave 4.

  • Intermediate Wave (4) Orange concluded near the 395 level in February 2023.
  • The upward movement can be subdivided into five waves: Minor Waves 1 through 4 have completed, while Wave 5 is actively forming.
  • Minor Wave 3 was extended, which is typical of impulsive structures.

If the current structure holds, prices are expected to rise from the 1360 level, pushing towards and above 1600. However, a break below 1160 would signal a possible trend reversal.

ADANI-PORTS-and-SEZ-...


ADANI PORTS and SEZ – ADANIPORTS (4H Chart) Elliott Wave Technical Analysis

Function: Larger Degree Trend Higher (Intermediate degree, orange)

Mode: Motive

Structure: Impulse

Position: Minor Wave 5 Grey

Details:

  • Minor Wave 5 Grey is progressing within Intermediate Wave (5) Orange, maintaining support above 1160.
  • Minute Waves ((i)) and ((ii)) appear to have completed around the 1600 and 1300 levels, respectively.
  • If this structure holds, Minute Wave ((iii)) should begin soon.
  • Alternatively, if Minor Wave 5 Grey ended at 1630 (truncation), the stock may reverse to a bearish trend.

Invalidation Point: 1160

ADANI PORT & SEZ 4H Chart Technical Analysis and Potential Elliott Wave Counts:

The 4-hour chart for ADANI PORT & SEZ illustrates the subwaves following the completion of Minor Wave 4 around 1160 on June 6, 2024.

  • Minute Waves ((i)) and ((ii)) within Minor Wave 5 appear completed at the 1600 and 1300 levels, respectively.
  • If the structure remains intact, prices are expected to stay above 1160 as Minute Wave ((iii)) unfolds.

Technical Analyst: Harsh Japee

Source: visit Tradinglounge.com and learn From the Experts Join TradingLounge Here 

Previous: WIPRO Elliott Wave Technical Analysis

VALUE Offer - Buy 1 Month & Get 3 Months!Click here

Access 7 Analysts Over 200 Markets Covered. Chat Room With Support

ADANI-PORTS-and-SEZ-...


Conclusion:

ADANI PORT & SEZ remains in an upward trajectory within Minor Wave 5 of Intermediate Wave (5), with critical support at 1160 and a target above the 1600 level.

Related

Learn the key aspects of NAB Stock Analysis & Elliott Wave Technical Forecast: NATIONAL AUSTRALIA BANK LIMITED

Learn the key aspects of NAB Stock Analysis & Elliott Wave Technical Forecast: NATIONAL AUSTRALIA BANK LIMITED

Stay ahead with our comprehensive analysis of National Australia Bank (NAB) stocks using Elliott Wav...

Read More >
British Pound/Japanese Yen (GBPJPY) Forex Elliott Wave Technical Analysis: Comprehensive technical insights and forecasts

British Pound/Japanese Yen (GBPJPY) Forex Elliott Wave Technical Analysis: Comprehensive technical insights and forecasts

Discover in-depth GBPJPY Elliott Wave analysis, providing comprehensive technical insights and forec...

Read More >
Learn about the Potential Uptrend and the Bullish Wave: Cardano Crypto Price News and ADAUSD Elliott Wave Technical Analysis

Learn about the Potential Uptrend and the Bullish Wave: Cardano Crypto Price News and ADAUSD Elliott Wave Technical Analysis

This article provides an in-depth Elliott Wave Cardano (ADAUSD) analysis, focusing on key price move...

Read More >
Soybean Price Analysis: SoyBeans Elliott Wave Technical Analysis, Signals Recovery Amidst Potential Sell-Off

Soybean Price Analysis: SoyBeans Elliott Wave Technical Analysis, Signals Recovery Amidst Potential Sell-Off

Amidst a recent recovery in Soybean prices, Elliott wave analysis reveals a complex picture hinting ...

Read More >
Iron Ore (SGX TSI Index Futures) Elliott Wave Technical Analysis: It Examines key Price Movementsand Potential Corrections

Iron Ore (SGX TSI Index Futures) Elliott Wave Technical Analysis: It Examines key Price Movementsand Potential Corrections

This article provides an in-depth Elliott Wave analysis of the SGX TSI Iron Ore Index, focusing on l...

Read More >
The Elliott Wave Analysis for Texas Instruments Inc. (TXN) Reveals a Bullish Trend, Supported by Both the Daily and 1-hour Charts

The Elliott Wave Analysis for Texas Instruments Inc. (TXN) Reveals a Bullish Trend, Supported by Both the Daily and 1-hour Charts

Our Elliott Wave analysis for Texas Instruments Inc. (TXN) highlights a bullish trend, with both dai...

Read More >

Buy 1 Month

Get 3 Months!

Special Offer:

Trade Recommendations

Unleash the power of deversified trading with our comprehensive portfolio, covering:

  • Stock Trades
  • Crypto Trades
  • Forex Trades
  • Commodity Trades
Elliott Wave Analysis

Gain a competive edge with expert insights in to:

  • Global Indices
  • US Stocks & ASX Stocks
  • Forex & Crypto
  • Commodities
Top-Notch Trading Tools

Equip yourself with the tools of success:

  • Social Chat
  • Elliott Wave Algorithm
  • Screener
  • TradingLevels
  • Trading Game
7 Elliott Wave Analysts

Stay ahead of the market with daily charts and insightful videos
-Your secret to strategic trading!

JOIN HERE


Welcome to TradingLounge (ASIC A.R.No. 321187), specialists in trades, trading education and technical analysis, covering stocks, indices, commodities, forex and cryptocurrencies.

When you join TradingLounge you have access to everything we offer, including trade tools, educational content and a social platform to chat with like-minded investors.

Read more

@Copyright 2024 by tradinglounge.com

Contact Us

Australian no: 02 4787 6020

International no: +61 (2) 47876020

Pay with:

Find us on