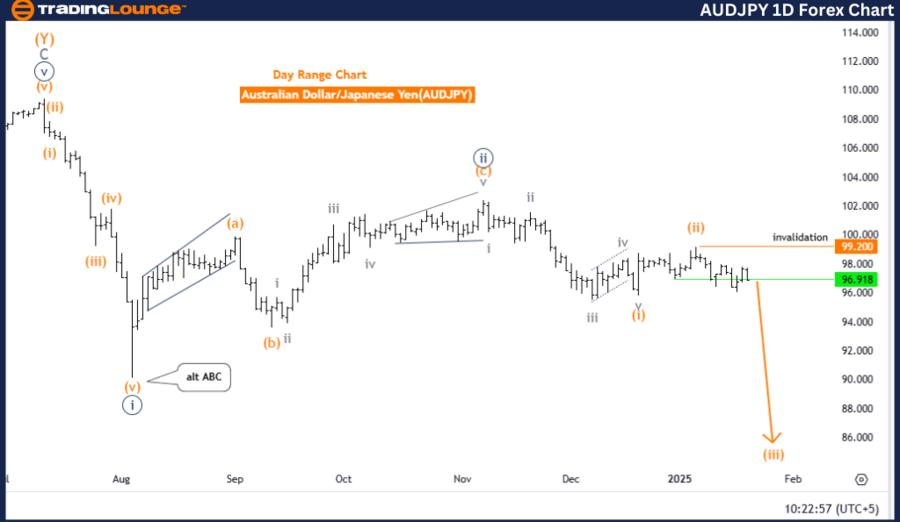
Australian Dollar / Japanese Yen (AUDJPY) Day Chart Analysis
AUDJPY Elliott Wave Technical Analysis
Function: Bearish Trend
Mode: Impulsive
Structure: Orange Wave 3
Position: Navy Blue Wave 3
Direction Next Lower Degrees: Orange Wave 3 (In Progress)
Details: Orange wave 2 has likely completed, with orange wave 3 now unfolding.
Wave Cancel Invalidation Level: 99.200
Analysis Overview
The daily AUDJPY chart reflects a strong bearish trend in line with Elliott Wave analysis, indicating an impulsive move within the current structure. The active wave, identified as orange wave 3, suggests continued downward momentum, highlighting the potential for further price declines.
Within the larger wave framework, the market currently positions itself within navy blue wave 3, reinforcing bearish sentiment. This phase plays a key role in the extended downtrend, with orange wave 3 actively driving the price lower.
The prior completion of orange wave 2 marked the beginning of the next downward phase, supporting the ongoing Elliott Wave count. Lower degree wave analysis continues to align with the progression of orange wave 3, further confirming the bearish outlook.
Key Invalidation Level
A critical invalidation level for the current wave count is set at 99.200. If the price moves above this threshold, the existing analysis would require reassessment. As long as the price remains below this key level, the bearish outlook stays valid, providing a structured forecast for future market movement.
Conclusion
In conclusion, the AUDJPY Elliott Wave day chart maintains a persistent bearish outlook, with orange wave 3 progressing within the larger navy blue wave 3 structure. The completion of orange wave 2 has paved the way for further downward price action. The key invalidation level of 99.200 remains crucial in maintaining the bearish bias, with further declines expected as the wave unfolds.
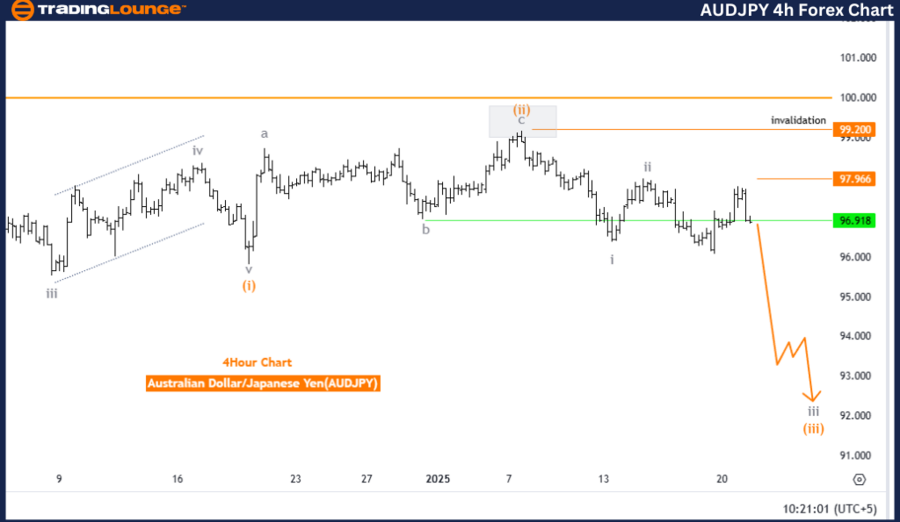
Australian Dollar / Japanese Yen (AUDJPY) 4-Hour Chart Analysis
AUDJPY Elliott Wave Technical Analysis
Function: Bearish Trend
Mode: Impulsive
Structure: Gray Wave 3
Position: Orange Wave 3
Direction Next Lower Degrees: Gray Wave 3 (In Progress)
Details: Gray wave 2 has likely ended, and gray wave 3 is currently developing.
Wave Cancel Invalidation Level: 99.200
Analysis Overview
The AUDJPY 4-hour chart follows a prevailing bearish trend, as indicated by Elliott Wave theory. The market's impulsive nature is reflected in the active wave structure, identified as gray wave 3, which suggests an ongoing downward move with potential for further price declines.
Currently positioned within orange wave 3, the market remains in a crucial stage within the broader gray wave 3 development. This highlights the continuation of the bearish trend, aligning with previous expectations. The completion of gray wave 2 signifies a shift to the next bearish phase, which is now unfolding.
The wave direction at lower degrees remains consistent with the current bearish movement, reinforcing expectations for continued downward momentum as the gray wave 3 structure progresses.
Key Invalidation Level
The key invalidation level for this analysis is set at 99.200. A price movement above this threshold would invalidate the existing wave count and require a revised market assessment. However, as long as the price remains below this level, the bearish wave scenario continues to hold.
Conclusion
In summary, the AUDJPY 4-hour Elliott Wave analysis supports the continuation of a bearish trend, with gray wave 3 progressing after the completion of gray wave 2. The market's positioning within orange wave 3 confirms the downtrend, with the 99.200 invalidation level serving as a key reference for traders. Further declines are expected as gray wave 3 unfolds, reinforcing the broader bearish sentiment.
Technical Analyst: Malik Awais
Source: visit Tradinglounge.com and learn From the Experts Join TradingLounge Here
Previous: USDCHF Elliott Wave Technical Analysis
VALUE Offer - Buy 1 Month & Get 3 Months!Click here
Access 7 Analysts Over 200 Markets Covered. Chat Room With Support