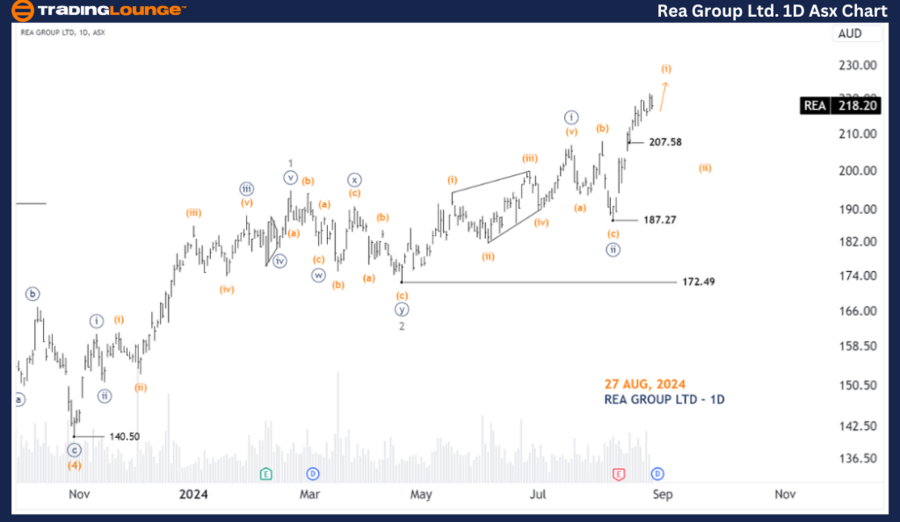
ASX: REA GROUP LTD – REA Elliott Wave Technical Analysis TradingLounge (1D Chart)

Welcome to our updated Elliott Wave analysis for the Australian Stock Exchange (ASX), focusing on REA GROUP LTD – REA. Our analysis suggests that REA.ASX may be progressing higher within wave ((iii))-navy.

ASX: REA GROUP LTD – REA Elliott Wave Technical Analysis

ASX: REA GROUP LTD – REA 1D Chart (Semilog Scale) Analysis

Function: Major trend (Minor degree, gray)

Mode: Motive

Structure: Impulse

Position: Wave (i)-orange of Wave ((iii))-navy

Details:
Wave ((iii))-navy appears to be advancing further, currently unfolding into wave (i)-orange. If a significant decline occurs, it would suggest the development of wave (ii)-orange, indicating a temporary push lower. Eventually, wave (iii)-orange is expected to resume the upward movement. A drop below 207.58 would confirm the unfolding of wave (ii)-orange. We anticipate a Long Trade Setup once wave (ii)-orange completes.

Invalidation Point: 187.27 

Rea-Group-ltd-1D-Asx...


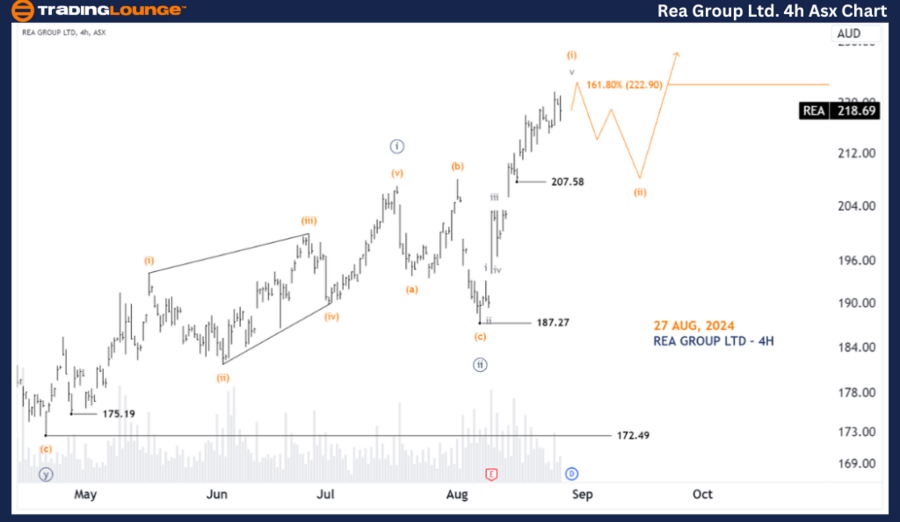
ASX: REA GROUP LTD – REA Elliott Wave Technical Analysis TradingLounge (4-Hour Chart)

ASX: REA GROUP LTD – REA Elliott Wave Technical Analysis

ASX: REA GROUP LTD – REA 4-Hour Chart Analysis

Function: Major trend (Minute degree, navy)

Mode: Motive

Structure: Impulse

Position: Wave (i)-orange of Wave ((iii))-navy

Details:
Following the low of 172.49, waves ((i)) and ((ii)) of the navy degree have completed. Wave ((iii))-navy is now emerging from the low of 187.27, subdividing into wave (i)-orange. Wave (i)-orange is expected to complete soon, leading to the development of wave (ii)-orange, which would push lower before wave (iii)-orange resumes the upward movement. A move below 207.58 would indicate that wave (ii)-orange is underway. We will be looking for a Long Trade Setup once wave (ii)-orange is complete.

Invalidation Point: 187.27

Conclusion:

Our analysis provides an insightful forecast of both contextual and short-term trends for ASX: REA GROUP LTD – REA. We offer key price points that serve as validation or invalidation signals for our wave count, helping to bolster confidence in our analysis. By combining these factors, we aim to deliver the most objective and professional perspective on current market trends.

Technical Analyst:  Hua (Shane) Cuong, CEWA-M (Master’s Designation).

Source: visit Tradinglounge.com and learn From the Experts Join TradingLounge Here 

See Previous: WTC Elliott Wave Technical Analysis 

Special Trial Offer - 0.76 Cents a Day for 3 Months! Click here

Access 7 Analysts Over 200 Markets Covered. Chat Room With Support

Rea-Group-ltd-4H-Asx...

Related

Wheat Commodity Elliott Wave Technical Analysis: Bullish Corrections and Future Price Movements in Wheat Futures

Wheat Commodity Elliott Wave Technical Analysis: Bullish Corrections and Future Price Movements in Wheat Futures

Our latest wheat price forecast for 2024 is based on Elliott Wave analysis, highlighting key market ...

Read More >
BTCUSD Elliott Wave Analysis: Bitcoin Price Prediction, Trading Strategy, Support & Resistance Levels, and Crypto Market Trends

BTCUSD Elliott Wave Analysis: Bitcoin Price Prediction, Trading Strategy, Support & Resistance Levels, and Crypto Market Trends

Bitcoin Elliott Wave Forecast with detailed BTCUSD price analysis. Our BTC/USD trading strategy expl...

Read More >
Theta Token/ U.S. dollar(THETAUSD) Elliott Wave Technical Analysis 8 December 23

Theta Token/ U.S. dollar(THETAUSD) Elliott Wave Technical Analysis 8 December 23

Theta Token/ U.S. dollar(THETAUSD) Elliott Wave Technical Analysis dated 8 December 23, Theta Token ...

Read More >
Natural Gas Commodity Elliott Wave Technical Analysis Predicts a Continuation of the Bearish Trend in 2024 and Offers Insights

Natural Gas Commodity Elliott Wave Technical Analysis Predicts a Continuation of the Bearish Trend in 2024 and Offers Insights

This article provides a detailed analysis of the natural gas market using Elliott Wave theory. It co...

Read More >
VanEck Gold Miners ETF (GDX) Elliott Wave Analysis: Bullish Trend, Resistance & Support Levels, and Investment Opportunities

VanEck Gold Miners ETF (GDX) Elliott Wave Analysis: Bullish Trend, Resistance & Support Levels, and Investment Opportunities

GDX Elliott Wave Analysis indicates a strong bullish trend, with a potential rally to new all-time h...

Read More >

$1 for 2 Weeks

then $29 a month!

What a Special Offer!

Trade Recommendations

Unleash the power of deversified trading with our comprehensive portfolio, covering 250+ markets:

  • Stock Trades
  • Crypto Trades
  • Forex Trades
  • Commodity Trades
Elliott Wave Analysis

Gain a competitive edge with expert insights and AI-powered Elliott Wave charting into:

  • Global Indices
  • US Stocks & ASX Stocks
  • Forex & Crypto
  • Commodities
Top-Notch Trading Tools

Equip yourself with the tools of success:

  • Real-time Chat rooms
  • Elliott Wave Algorithm
  • Portfolio tools
  • TradingLevels
  • Screener
  • Trading Game
7 Elliott Wave Analysts

Stay ahead of the market with daily charts and insightful videos
Your secret to strategic trading!

JOIN HERE


Welcome to TradingLounge (ASIC A.R.No. 321187), specialists in trades, trading education and technical analysis, covering stocks, indices, commodities, forex and cryptocurrencies.

When you join TradingLounge you have access to everything we offer, including trade tools, educational content and a social platform to chat with like-minded investors.

Read more

@Copyright 2024 by tradinglounge.com

Contact Us

Australian no: 02 4787 6020

International no: +61 (2) 47876020

Pay with:

Find us on