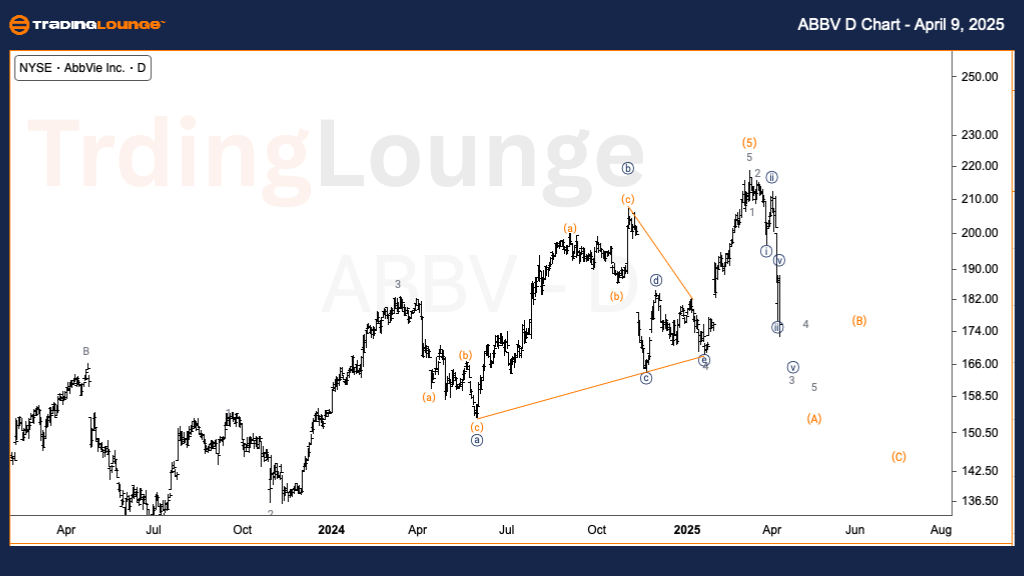
ABBV Elliott Wave Analysis - TradingLounge Daily Chart
Abbie Inc. Daily Chart Analysis
ABBV Elliott Wave Technical Analysis
Function: Counter Trend
Mode: Corrective
Structure: ZigZag
Position: Wave 3 of (A)
Direction: Downside within wave (A)
Details: ABBV stock is currently unfolding a ZigZag correction in Intermediate wave (A), with price action targeting the previous fourth wave near $165. The strong downward momentum highlights the initial phase of a potential bearish trend, reinforcing the Elliott Wave count of wave (A). This setup suggests further downside movement is likely.
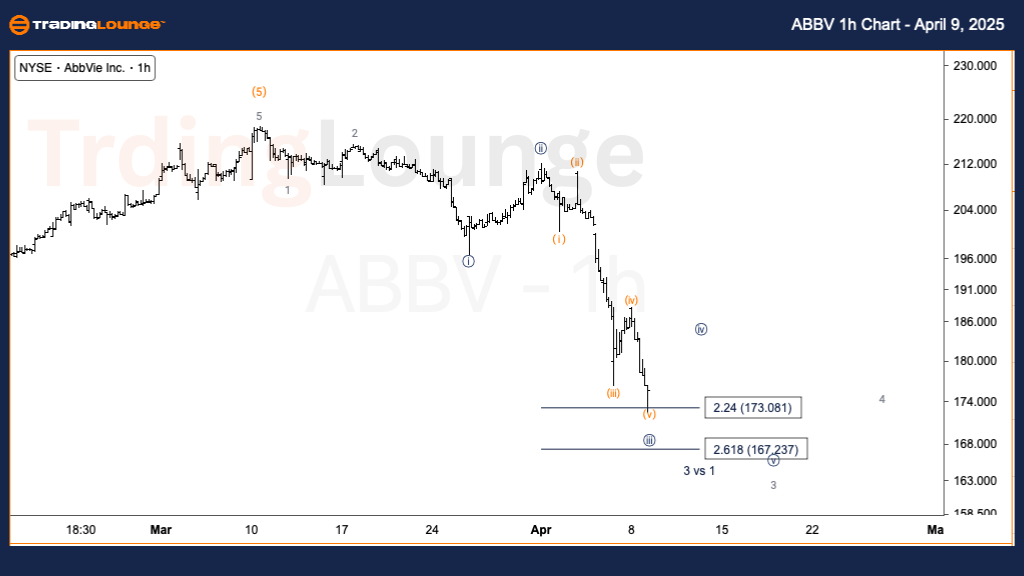
ABBV Elliott Wave Analysis - TradingLounge 1H Chart
Function: Counter Trend
Mode: Corrective
Structure: ZigZag
Position: Wave {iii} of 3
Direction: Downside in wave 3
Details: On the intraday chart, ABBV is moving lower within wave {iii} of 3, indicating short-term bearish continuation. As wave (A) progresses, expect smaller degree corrective patterns to emerge, offering potential intraday trading setups aligned with the prevailing downtrend.
Technical Analyst: Alessio Barretta
Source: Visit Tradinglounge.com and learn from the Experts. Join TradingLounge Here
Previous: Netflix Inc. (NFLX) Elliott Wave Technical Analysis
VALUE Offer - Buy 1 Month & Get 3 Months!Click here
Access 7 Analysts Over 200 Markets Covered. Chat Room With Support
ABBV Summary
ABBV stock shows clear Elliott Wave corrective structure across both daily and 1-hour timeframes, signaling a developing ZigZag pattern within Intermediate wave (A). With wave 3 extending to the downside, price is expected to approach the $165 support level. Momentum aligns with a deeper correction underway. The 1-hour wave count, currently in wave {iii}, suggests additional short-term bearish setups as wave (A) continues to unfold.