ASX: INSURANCE AUSTRALIA GROUP LIMITED Stock – TradingLounge (1D Chart)
Greetings,
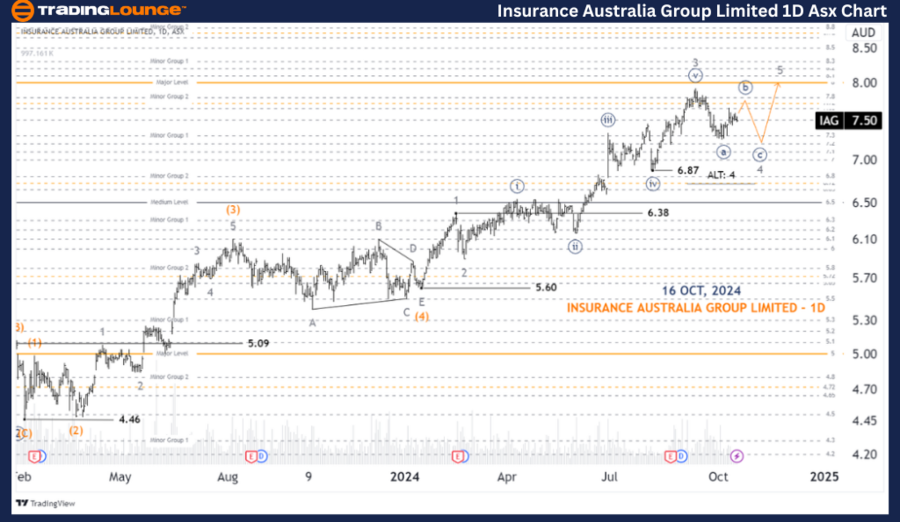
Our latest Elliott Wave analysis provides an update on the Australian Stock Exchange (ASX) for INSURANCE AUSTRALIA GROUP LIMITED – IAG. We observe IAG preparing to advance with wave 5-grey, though wave 4-grey still needs time to finish its movement.
IAG Elliott Wave Technical Analysis
ASX: INSURANCE AUSTRALIA GROUP LIMITED – IAG 1D Chart (Semilog Scale) Analysis
Function: Major trend (Intermediate degree, orange)
Mode: Motive
Structure: Impulse
Position: Wave 4-grey of Wave (5)-orange
Details:
Wave 4-grey seems to be trending downward and may target around 6.87. Following this, wave 5-grey is expected to push higher, potentially reaching even higher levels in the upcoming rally.
Invalidation point: 6.38

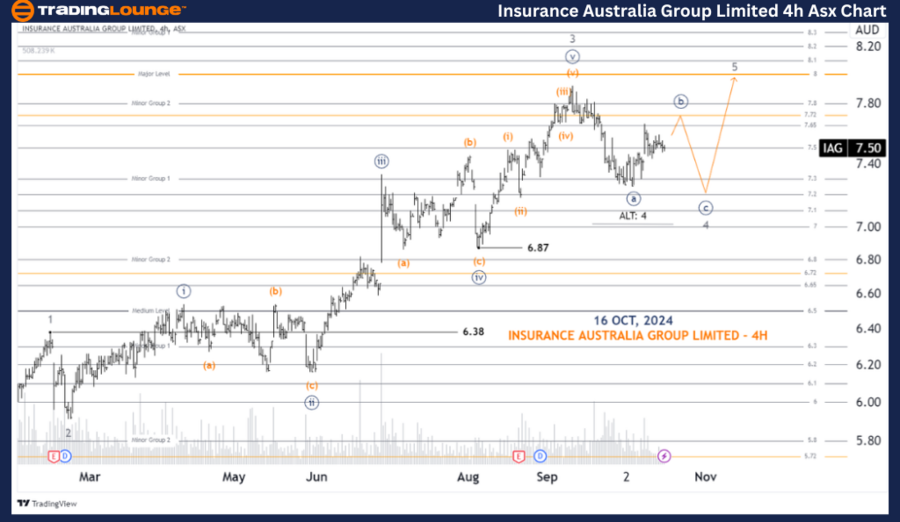
ASX: INSURANCE AUSTRALIA GROUP LIMITED – IAG 4-Hour Chart Analysis
Function: Major trend (Minor degree, grey)
Mode: Motive
Structure: Impulse
Position: Wave ((b))-navy of Wave 4-grey
Details:
Upon closer analysis of the 4-grey wave, the first leg of the Zigzag pattern appears complete and labeled as wave ((a)). The second leg, identified as ((c))-navy, is anticipated to continue pushing the price downward. It is expected that wave 4-grey will extend its correction for some time.
Invalidation point: 6.38
Technical Analyst: Hua (Shane) Cuong, CEWA-M (Master’s Designation).
Source: visit Tradinglounge.com and learn From the Experts Join TradingLounge Here
See Previous: COCHLEAR LIMITED - COH Elliott Wave Technical Analysis

Conclusion
Our Elliott Wave analysis of ASX: INSURANCE AUSTRALIA GROUP LIMITED – IAG delivers insight into the current trends and potential price movements. We highlight specific price points that serve as validation or invalidation signals to solidify our wave count, giving traders added confidence in their strategies. By focusing on these critical levels, we aim to provide a professional and objective perspective on IAG’s market trends.