30May

Elliott Wave Analysis of BLOCK INC (ASX:SQ2): Projecting Wave 3 Targets and Identifying Key Support for Bullish Continuation

BLOCK, INC – XYZ (SQ2) Elliott Wave Technical Analysis - TradingLounge

Greetings,
This updated Elliott Wave analysis of BLOCK, INC – XYZ (ASX:SQ2) highlights a strengthening bullish trend. Current patterns suggest wave 3) (orange degree) could potentially push the price toward the 125.44–159.74 range. This outlook defines essential price targets and support levels that reinforce the bullish scenario for ASX:SQ2.

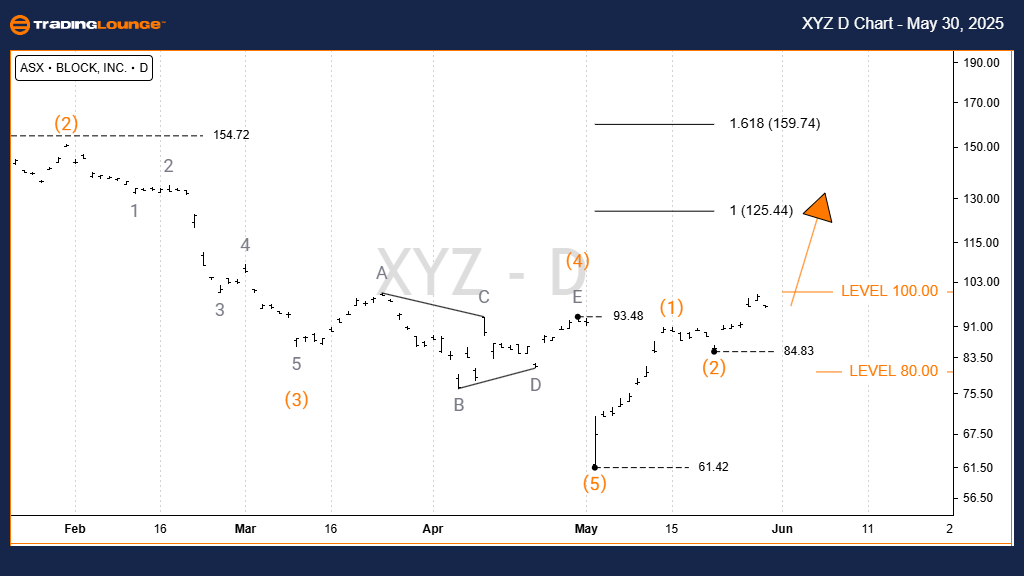
BLOCK, INC – XYZ (SQ2) Technical Overview – 1D Chart (Semilog Scale)

Function: Major Trend (Intermediate degree, orange)

Mode: Motive

Structure: Impulse

Position: Wave 3) – orange

Analysis Highlights:

The stock likely completed wave 1) – orange around the 61.42 level. Wave 2) – orange has probably ended near 84.83. Now, wave 3) – orange is unfolding, with upside targets set between 125.44 and 159.74. The positive trend projection remains intact as long as the price stays above the 84.83 support threshold.

Critical Invalidation Level: 84.83

XYZ-day-asx-chart-30...


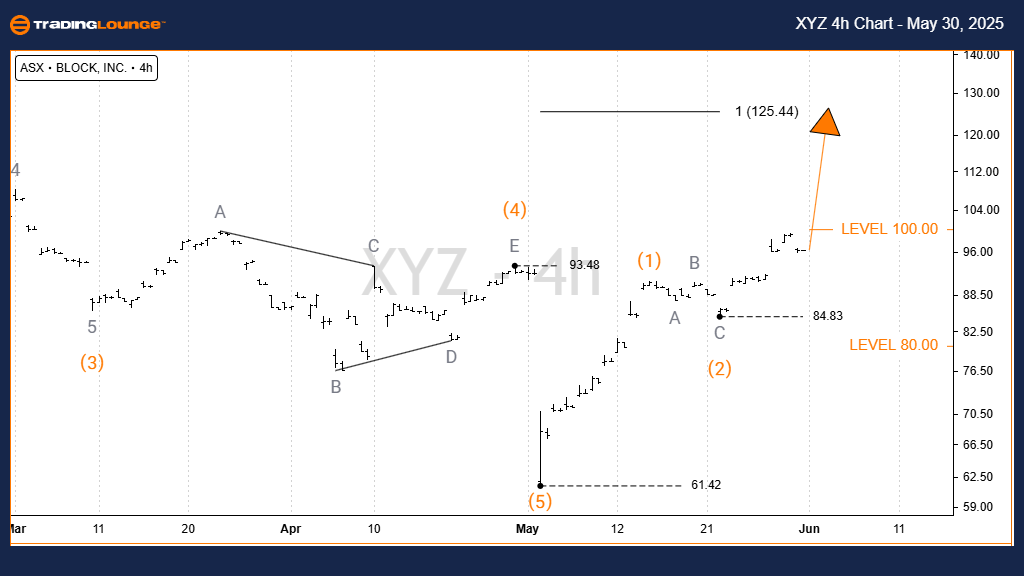
BLOCK, INC – XYZ (SQ2) Elliott Wave Technical Analysis – TradingLounge (4-Hour Chart)

4-Hour Chart Breakdown:

Function: Major Trend (Intermediate degree, orange)

Mode: Motive

Structure: Impulse

Position: Wave 3) – orange

Chart Insights:
The 4-hour time frame aligns with the daily chart outlook. Wave 1) – orange likely finalized at 61.42, and wave 2) – orange concluded around 84.83. Currently, wave 3) – orange is taking shape, aiming for the projected 125.44–159.74 range. This upward trajectory holds, provided the price remains above the critical 84.83 level.

Key Invalidation Point: 84.83

Technical Analyst: Hua (Shane) Cuong, CEWA-M (Master’s Designation).

Source: Visit Tradinglounge.com and learn from the Experts. Join TradingLounge Here 

See Previous: ASX: NEM Elliott Wave Technical Analysis

VALUE Offer - Buy 1 Month & Get 3 Months!Click here

Access 7 Analysts Over 200 Markets Covered. Chat Room With Support

XYZ-4h-asx-chart-300...


Conclusion:
This Elliott Wave outlook for BLOCK, INC – XYZ (SQ2) outlines a bullish market structure with favorable trade setups. By identifying important price zones and wave patterns, this analysis supports strategic trading decisions. Traders can rely on this structure-based approach to navigate the ASX:SQ2 market environment with confidence.

Related

Chevron Stock Analysis: Elliott Wave Theory Insights, Daily and 1-Hour Chart Forecasts, CVX Price Targets, and Future Stock Trends

Chevron Stock Analysis: Elliott Wave Theory Insights, Daily and 1-Hour Chart Forecasts, CVX Price Targets, and Future Stock Trends

Analyze Chevron (CVX) stock trends using Elliott Wave Theory. This detailed breakdown includes daily...

Read More >
British Pound to US Dollar Forex Currency Pair: GBPUSD Forex Elliott Wave Technical Analysis

British Pound to US Dollar Forex Currency Pair: GBPUSD Forex Elliott Wave Technical Analysis

This article provides a thorough GBPUSD Elliott Wave Analysis, covering essential aspects such as pr...

Read More >
NASDAQ Elliott Wave Analysis: SPX, JPM, AAPL, AMZN, NVDA, TSLA, GOOGL, META, NFLX, MSFT 2024 Forecast

NASDAQ Elliott Wave Analysis: SPX, JPM, AAPL, AMZN, NVDA, TSLA, GOOGL, META, NFLX, MSFT 2024 Forecast

This article offers a detailed Elliott Wave analysis of the NASDAQ stock market, focusing on key tec...

Read More >
U.S. Dollar / Japanese Yen (USDJPY) Forex Elliott Wave Technical Analysis Reveals Key Correction and Wave Breakout Setup

U.S. Dollar / Japanese Yen (USDJPY) Forex Elliott Wave Technical Analysis Reveals Key Correction and Wave Breakout Setup

USDJPY shows a corrective wave 2 unfolding in a broader bullish trend. Watch for reversal signals an...

Read More >
NVIDIA Corp. (NVDA) Elliott Wave Analysis: Bullish Trend Outlook, Price Prediction, Technical Analysis, and Wave 3 Projection

NVIDIA Corp. (NVDA) Elliott Wave Analysis: Bullish Trend Outlook, Price Prediction, Technical Analysis, and Wave 3 Projection

This NVIDIA Elliott Wave Analysis provides an in-depth look at NVDA's stock trend, identifying k...

Read More >
NVDA's Future: NVIDIA Corp. (NVDA) Elliott Wave Technical Analysis Reveals Insights

NVDA's Future: NVIDIA Corp. (NVDA) Elliott Wave Technical Analysis Reveals Insights

Elliott Wave analysis of NVIDIA Corp. (NVDA) as of February 21, 24, unveils a tale of intricate wave...

Read More >

$1 for 2 Weeks

then $29 a month!

What a Special Offer!

Trade Recommendations

Unleash the power of deversified trading with our comprehensive portfolio, covering 250+ markets:

  • Stock Trades
  • Crypto Trades
  • Forex Trades
  • Commodity Trades
Elliott Wave Analysis

Gain a competitive edge with expert insights and AI-powered Elliott Wave charting into:

  • Global Indices
  • US Stocks & ASX Stocks
  • Forex & Crypto
  • Commodities
Top-Notch Trading Tools

Equip yourself with the tools of success:

  • Real-time Chat rooms
  • Elliott Wave Algorithm
  • Portfolio tools
  • TradingLevels
  • Screener
  • Trading Game
7 Elliott Wave Analysts

Stay ahead of the market with daily charts and insightful videos
Your secret to strategic trading!

JOIN HERE


Welcome to TradingLounge (ASIC A.R.No. 321187), specialists in trades, trading education and technical analysis, covering stocks, indices, commodities, forex and cryptocurrencies.

When you join TradingLounge you have access to everything we offer, including trade tools, educational content and a social platform to chat with like-minded investors.

Read more

@Copyright 2024 by tradinglounge.com

Contact Us

Australian no: 02 4787 6020

International no: +61 (2) 47876020

Pay with:

Find us on