Analysis of Berkshire Hathaway Inc. (BRK.B) Using Elliott Wave Theory: Daily and 1-Hour Chart Insights

This article provides an in-depth analysis of Berkshire Hathaway Inc. (BRK.B) by applying the Elliott Wave Theory to evaluate current trends and predict future price action. We focus on the daily and 1-hour charts to offer a comprehensive overview.

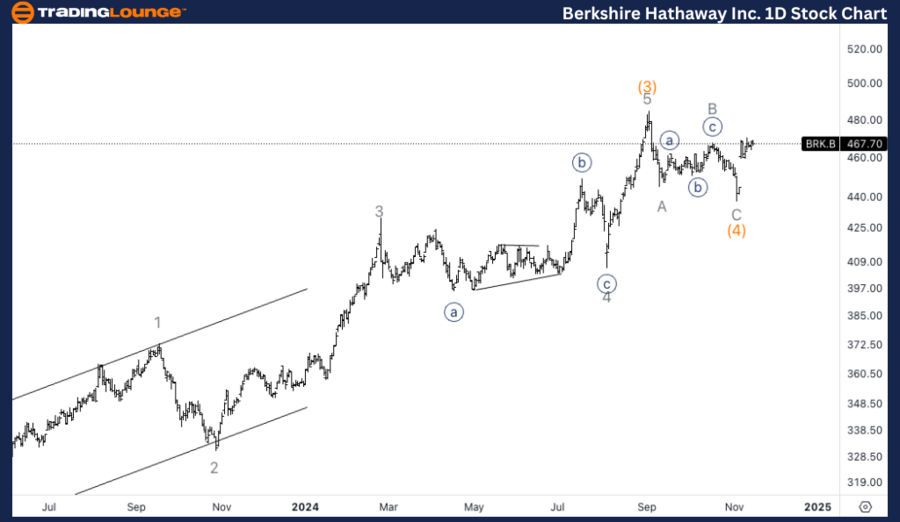
BRK.B Elliott Wave Analysis - TradingLOunge Daily Chart

Berkshire Hathaway Inc. (BRK.B) Daily Chart Analysis

BRK.B Elliott Wave Technical Analysis

Function: Trend

Mode: Impulsive

Structure: Motive

Position: Wave 1 of (5)

Direction: Upside in wave (5)

Details:
Berkshire Hathaway (BRK.B) appears to have concluded a corrective wave (4), which was likely a three-wave move. The price is now targeting an upward progression in wave (5) and is currently positioned just below the critical TradingLevel5 at $500. A break above this resistance level is expected to confirm continued upward momentum.

BRK.B Stock Technical Analysis – Daily Chart

On the daily chart, BRK.B is preparing to continue its ascent as part of wave (5) following the likely completion of a three-wave corrective structure in wave (4). The price currently faces resistance at the key psychological level of $500 (TradingLevel5). A successful breach of this level would provide further confirmation of the anticipated upside, signaling the continuation of the bullish trend in wave (5).

Berkshire-Hathaway-I...


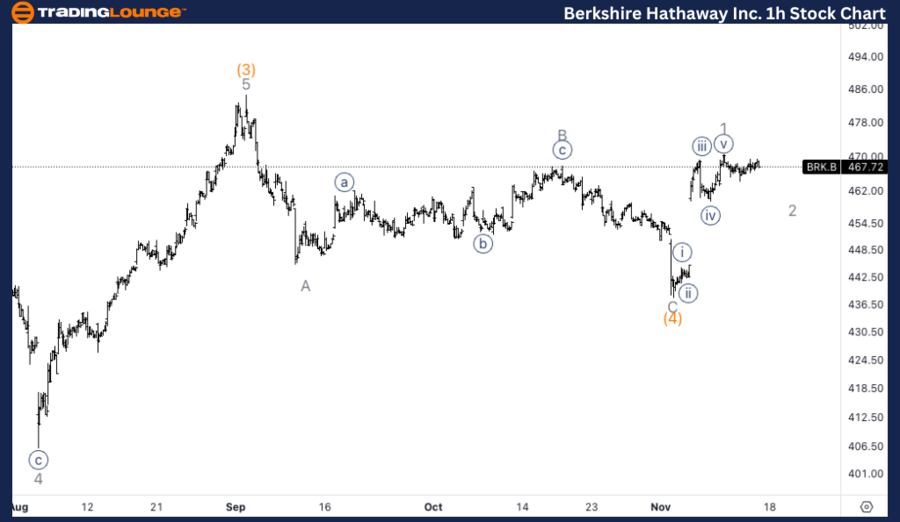
Berkshire Hathaway Inc. (BRK.B) TradingLounge 1-Hour Chart

BRK.B Elliott Wave Technical Analysis

Function: Trend

Mode: Impulsive

Structure: Motive

Position: Wave 1 of (5)

Direction: Pullback in wave 2

Details:
BRK.B is likely in the process of completing wave 2 within wave (5). There is evidence that another downward leg may be missing, indicating that wave 2 has yet to fully unfold. The stock could find support around $465, which may act as a turning point before resuming the upward movement in wave 3 of (5).

Berkshire Hathaway Inc. Technical Analysis – 1-Hour Chart

The 1-hour chart suggests that BRK.B is still in wave 2 of the larger wave (5). The analysis points to at least one more downward leg before the corrective structure is complete. Support near $465 could mark the end of wave 2, setting the stage for the stock to bottom out and begin the next upward leg in wave 3 of (5).

Technical Analyst: Alessio Barretta

Source: visit Tradinglounge.com and learn From the Experts Join TradingLounge Here 

See Previous: QUALCOMM Inc. (QCOM) Elliott Wave Technical Analysis

VALUE Offer - Buy 1 Month & Get 3 Months!Click here

Access 7 Analysts Over 200 Markets Covered. Chat Room With Support

Berkshire-Hathaway-I...

Related

Unlocking ASX Trading Success: RAMSAY HEALTH CARE LIMITED - RHC Stock Analysis & Elliott Wave Technical Analysis

Unlocking ASX Trading Success: RAMSAY HEALTH CARE LIMITED - RHC Stock Analysis & Elliott Wave Technical Analysis

Our detailed Elliott Wave analysis of ASX RAMSAY HEALTH CARE LIMITED (RHC) highlights key stock tren...

Read More >
Silver (XAGUSD) Price and Elliott Wave Technical Analysis: Buy the Dip for Profitable Silver Trading

Silver (XAGUSD) Price and Elliott Wave Technical Analysis: Buy the Dip for Profitable Silver Trading

This comprehensive guide offers valuable insights into Silver trading, covering essential topics suc...

Read More >
Elliott Wave Analysis and Trading Strategies for NASDAQ and Major Tech Stocks

Elliott Wave Analysis and Trading Strategies for NASDAQ and Major Tech Stocks

This week, our Elliott Wave analysis tracks two bullish counts for the NASDAQ 100 (NDX) and key tech...

Read More >
Palo Alto Networks (PANW) Elliott Wave Analysis: Stock Forecast, Bullish Trend, Resistance Levels & Investment Strategy

Palo Alto Networks (PANW) Elliott Wave Analysis: Stock Forecast, Bullish Trend, Resistance Levels & Investment Strategy

Palo Alto Networks Inc. (PANW) is showing strong bullish momentum based on Elliott Wave analysis. Th...

Read More >
Comprehensive AUDJPY Elliott Wave Analysis: Technical Forecast, Trading Strategies, and Market Outlook for Informed Forex Decisions

Comprehensive AUDJPY Elliott Wave Analysis: Technical Forecast, Trading Strategies, and Market Outlook for Informed Forex Decisions

This comprehensive analysis delves into the AUDJPY currency pair using Elliott Wave theory, highligh...

Read More >
Strategies for Forex Traders aiming to Capitalize on the EURUSD Market Trends: Euro/ U.S. Dollar Elliott Wave Technical Analysis

Strategies for Forex Traders aiming to Capitalize on the EURUSD Market Trends: Euro/ U.S. Dollar Elliott Wave Technical Analysis

This comprehensive analysis provides an in-depth look at the EURUSD using Elliott Wave Theory. Disco...

Read More >

$1 for 2 Weeks

then $29 a month!

What a Special Offer!

Trade Recommendations

Unleash the power of deversified trading with our comprehensive portfolio, covering 250+ markets:

  • Stock Trades
  • Crypto Trades
  • Forex Trades
  • Commodity Trades
Elliott Wave Analysis

Gain a competitive edge with expert insights and AI-powered Elliott Wave charting into:

  • Global Indices
  • US Stocks & ASX Stocks
  • Forex & Crypto
  • Commodities
Top-Notch Trading Tools

Equip yourself with the tools of success:

  • Real-time Chat rooms
  • Elliott Wave Algorithm
  • Portfolio tools
  • TradingLevels
  • Screener
  • Trading Game
7 Elliott Wave Analysts

Stay ahead of the market with daily charts and insightful videos
Your secret to strategic trading!

JOIN HERE


Welcome to TradingLounge (ASIC A.R.No. 321187), specialists in trades, trading education and technical analysis, covering stocks, indices, commodities, forex and cryptocurrencies.

When you join TradingLounge you have access to everything we offer, including trade tools, educational content and a social platform to chat with like-minded investors.

Read more

@Copyright 2024 by tradinglounge.com

Contact Us

Australian no: 02 4787 6020

International no: +61 (2) 47876020

Pay with:

Find us on