18Nov

USDCHF Forex Elliott Wave Analysis: U.S. Dollar / Swiss Franc Currency Pair Technical Insights and Trading Strategies

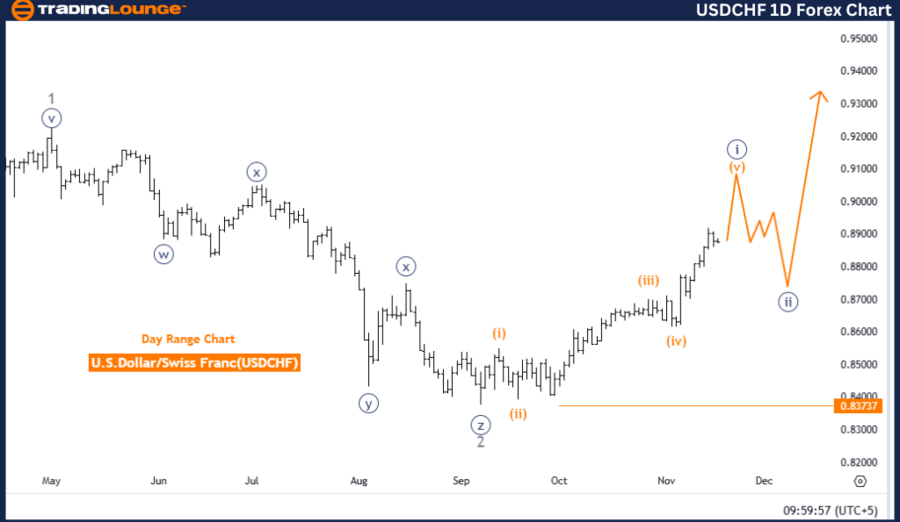
USDCHF Elliott Wave Analysis - Trading Lounge Day Chart

U.S. Dollar / Swiss Franc (USDCHF) Day Chart Analysis

USDCHF Elliott Wave Technical Analysis

Function: Bullish Trend

Mode: Impulsive

Structure: Orange Wave 5

Position: Navy Blue Wave 1

Direction Next Lower Degrees: Navy Blue Wave 2

Wave Cancel Invalidation Level: 0.83737

Detailed Analysis:
The USDCHF daily chart indicates a bullish trend with an impulsive Elliott Wave structure. The analysis pinpoints orange wave 5 as active within navy blue wave 1, projecting an ongoing upward trajectory for the USDCHF pair. The completion of orange wave 4 sets the stage for orange wave 5 to advance, suggesting further gains in the market.

In Elliott Wave theory, wave 5 represents the final phase of an impulsive sequence, often characterized by reaching new highs before a corrective phase ensues. For the USDCHF, the ongoing development of orange wave 5 reinforces bullish momentum, signaling the potential for further appreciation in the near term.

Key Validation Level:
The invalidation level is established at 0.83737. A drop to or below this price would invalidate the current wave structure, potentially signaling a weakening or reversal of the bullish trend. Monitoring this level is critical for traders, as any breach would require a reevaluation of the bullish outlook.

Summary:
The USDCHF Elliott Wave analysis on the daily chart confirms a bullish outlook, with orange wave 5 within navy blue wave 1 suggesting continued upward momentum. Traders should focus on the invalidation level at 0.83737, as a breach could signal a trend reversal or weakness in the current bullish setup.

USDCHF-1d-forex-char...


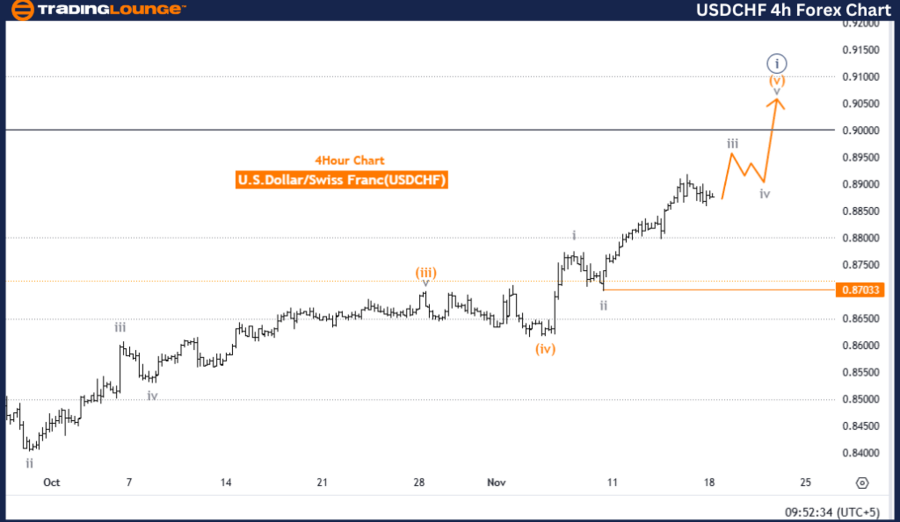
U.S. Dollar / Swiss Franc (USDCHF) – Trading Lounge 4-Hour Chart

USDCHF Forex Pair Technical Analysis

Function: Bullish Trend

Mode: Impulsive

Structure: Gray Wave 3

Position: Orange Wave 5

Direction Next Lower Degrees: Gray Wave 4

Wave Cancel Invalidation Level: 0.87033

Detailed Analysis:
The USDCHF 4-hour chart highlights a bullish trend, driven by an impulsive Elliott Wave structure. The current phase is gray wave 3, with orange wave 5 advancing within this broader wave, indicating sustained upward momentum for the currency pair. The completion of gray wave 2 has led to the activation of gray wave 3, often regarded as the strongest phase of an impulsive wave.

In Elliott Wave theory, wave 3 typically exhibits the most pronounced price movements, with substantial market advances. The ongoing development of orange wave 5 within this phase supports continued bullish momentum, with further gains anticipated until gray wave 4 initiates a corrective phase.

Key Validation Level:
The invalidation level is set at 0.87033. A decline to or below this level would invalidate the current wave structure, potentially signaling a shift away from the bullish trend. This level serves as a critical marker for traders to confirm the robustness of the ongoing wave pattern.

Summary:
The USDCHF Elliott Wave analysis on the 4-hour chart reinforces a bullish perspective, with gray wave 3 driving the upward trend supported by orange wave 5. Traders should closely watch the invalidation level at 0.87033, as a breach could challenge the bullish wave structure and indicate a possible trend reversal.

Technical Analyst: Malik Awais

Source: visit Tradinglounge.com and learn From the Experts Join TradingLounge Here 

Previous: AUDJPY Elliott Wave Technical Analysis

VALUE Offer - Buy 1 Month & Get 3 Months!Click here

Access 7 Analysts Over 200 Markets Covered. Chat Room With Support

USDCHF-4h-forex-char...

Related

Alphabet Inc.(GOOGL) Stocks Elliott Wave Technical Analysis To Identify Key Entry and Exit Points While Monitoring Market Trends

Alphabet Inc.(GOOGL) Stocks Elliott Wave Technical Analysis To Identify Key Entry and Exit Points While Monitoring Market Trends

This GOOGL Elliott Wave Analysis explores Alphabet Inc.'s stock trends using the Elliott Wave Th...

Read More >
Berkshire Hathaway (BRK.B) Elliott Wave Analysis: Stock Forecast, ZigZag Correction, Triangle Formation & Technical Outlook

Berkshire Hathaway (BRK.B) Elliott Wave Analysis: Stock Forecast, ZigZag Correction, Triangle Formation & Technical Outlook

Elliott Wave analysis of Berkshire Hathaway Inc. (BRK.B), focusing on a corrective zigzag structure ...

Read More >
U.S.Dollar/Japanese Yen(USDJPY) Forex Elliott Wave Technical Analysis: Impulsive Trends and Key Levels to Watch

U.S.Dollar/Japanese Yen(USDJPY) Forex Elliott Wave Technical Analysis: Impulsive Trends and Key Levels to Watch

Elliott Wave analysis of the USDJPY currency pair highlights the current trend, explains the impulsi...

Read More >
Natural Gas Elliott Wave Forecast Suggests Bullish Rally to $6.2 with Key Support and Resistance Levels Identified for Traders

Natural Gas Elliott Wave Forecast Suggests Bullish Rally to $6.2 with Key Support and Resistance Levels Identified for Traders

Natural Gas price action using Elliott Wave theory, identifying bullish patterns and projecting a po...

Read More >
JAMES HARDIE INDUSTRIES PLC (JHX) Elliott Wave Analysis: ASX JHX Stock Forecast, Market Trends and Trading Strategy for Investors

JAMES HARDIE INDUSTRIES PLC (JHX) Elliott Wave Analysis: ASX JHX Stock Forecast, Market Trends and Trading Strategy for Investors

JHX Elliott Wave analysis provides a detailed technical forecast for ASX JHX stock. With key price l...

Read More >
Nestle India Share Price Outlook: NESTLEIND Elliott Wave Analysis Signals Strong Bullish Trend with Key Levels and Forecast

Nestle India Share Price Outlook: NESTLEIND Elliott Wave Analysis Signals Strong Bullish Trend with Key Levels and Forecast

This analysis provides a technical outlook on Nestle India using Elliott Wave principles. It identif...

Read More >

$1 for 2 Weeks

then $29 a month!

What a Special Offer!

Trade Recommendations

Unleash the power of deversified trading with our comprehensive portfolio, covering 250+ markets:

  • Stock Trades
  • Crypto Trades
  • Forex Trades
  • Commodity Trades
Elliott Wave Analysis

Gain a competitive edge with expert insights and AI-powered Elliott Wave charting into:

  • Global Indices
  • US Stocks & ASX Stocks
  • Forex & Crypto
  • Commodities
Top-Notch Trading Tools

Equip yourself with the tools of success:

  • Real-time Chat rooms
  • Elliott Wave Algorithm
  • Portfolio tools
  • TradingLevels
  • Screener
  • Trading Game
7 Elliott Wave Analysts

Stay ahead of the market with daily charts and insightful videos
Your secret to strategic trading!

JOIN HERE


Welcome to TradingLounge (ASIC A.R.No. 321187), specialists in trades, trading education and technical analysis, covering stocks, indices, commodities, forex and cryptocurrencies.

When you join TradingLounge you have access to everything we offer, including trade tools, educational content and a social platform to chat with like-minded investors.

Read more

@Copyright 2024 by tradinglounge.com

Contact Us

Australian no: 02 4787 6020

International no: +61 (2) 47876020

Pay with:

Find us on