WTI Elliott Wave Analysis – Trading Lounge Forecast
WTI Crude Oil Elliott Wave Technical Overview
Trend: Bearish
Structure: Double Zigzag
Outlook: Continuation Expected Toward Sub-$50 Targets
Summary:
WTI Crude Oil continues to exhibit a bearish trend, following a short-lived rebound that concluded around June 22, 2025. The long-term corrective phase, which originated in March 2022, remains active. Based on current Elliott Wave structures, WTI Crude is projected to move lower, potentially reaching below the $50 mark. This sustained bearish outlook aligns with the incomplete wave structure, reinforcing downside expectations.
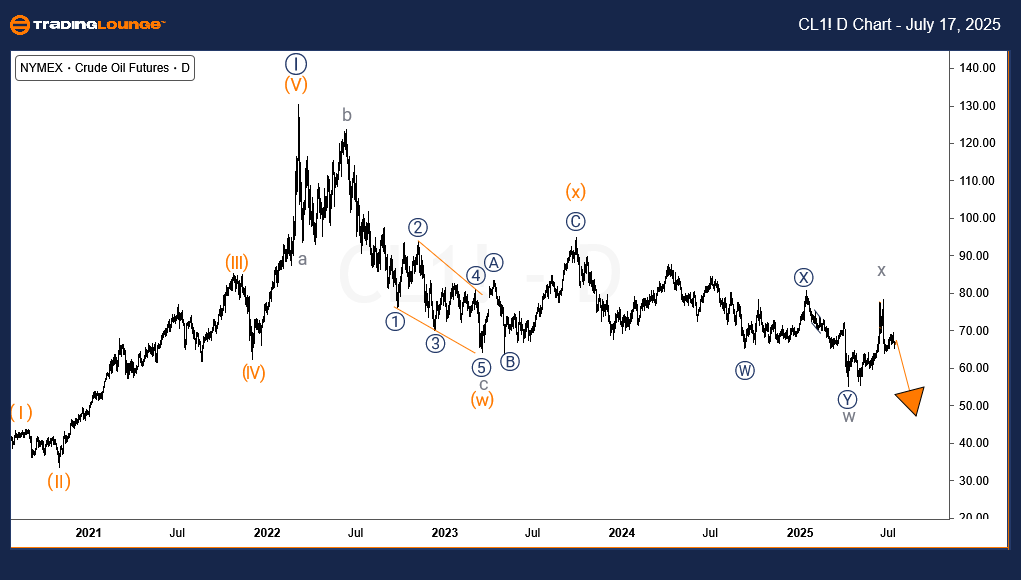
WTI Elliott Wave Analysis – Daily Chart
Daily price action for WTI Crude Oil supports a prolonged corrective structure that began in March 2022, acting as a counter to the impulsive rally starting April 2020. The formation continues to develop as a double zigzag pattern. Wave (w) finalized in March 2023, followed by wave (x) in September 2023.
Currently, wave (y) is in progress. Within this leg, sub-waves w and x of (y) finished in April 2025 and June 2025. The terminal wave y of (y) is likely unfolding now, with downside potential below the $50 level in the short to medium term.
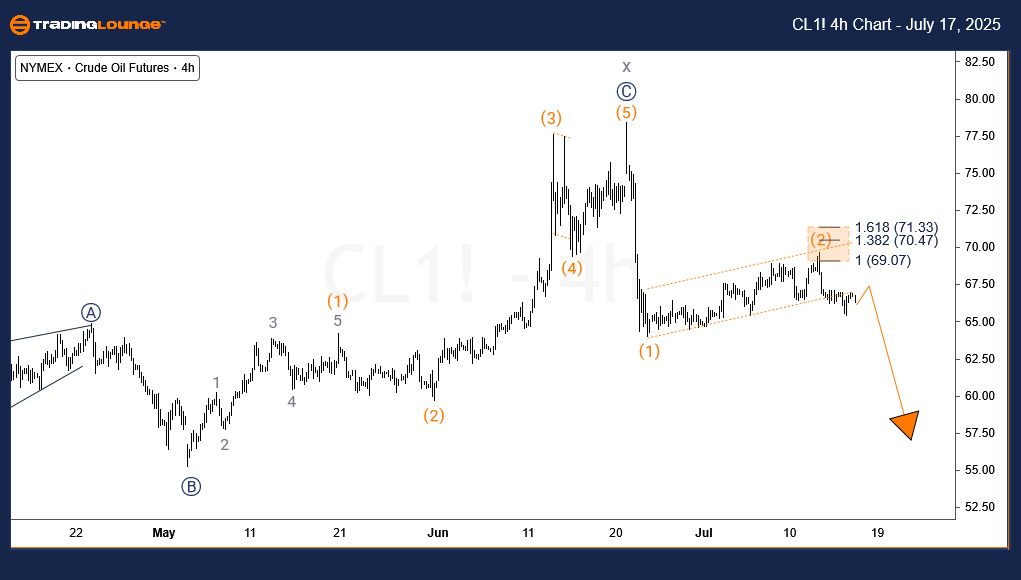
WTI Elliott Wave Analysis – 4-Hour Chart
The 4-hour chart adds clarity to the near-term bearish pattern. WTI appears to have completed waves (1) and (2) of ((A)) within wave y. As long as prices remain under the $69.7 level (wave (2) peak) and more critically, below $78.4 (wave x peak), sellers are expected to maintain control.
Wave (3) of ((A)) is forecasted to drive the commodity toward the $49 to $46 range. Continued resistance below these critical levels would validate further bearish momentum in the upcoming sessions.
Technical Analyst: Sanmi Adeagbo
Source: Visit Tradinglounge.com and learn from the Experts. Join TradingLounge Here
See Previous: Copper Elliott Wave Technical Analysis
VALUE Offer - $1 for 2 Weeks then $29 a month!Click here
Access 7 Analysts Over 200 Markets Covered. Chat Room With Support