23Jun

Copper Elliott Wave Analysis: Technical Forecast with Bullish Outlook, Support Levels & Market Trends for Smart Trading Strategy

Copper Elliott Wave Technical Analysis – TradingLounge Daily & H4 Charts

Market Outlook

Copper and other precious metals are undergoing a corrective phase after the strong rally observed in May. This correction is considered a natural part of the broader bullish cycle that initiated in April. The medium-term projection remains bullish, with expectations for higher prices once the current consolidation concludes.

Copper Daily Chart Analysis

The bullish momentum in Copper began in March 2020, forming a clear 5-wave diagonal advance that ended in March 2025. This structure is identified as wave (I) in the Elliott Wave sequence. According to Elliott Wave Theory, a 5-wave advance is typically followed by a 3-wave correction. Copper adhered to this expectation with a sharp decline post-March 2025, forming wave (II), which completed in April 2025.

After wave (II), a significant recovery took place. Given the strong movement of wave (II), some analysts may consider it an impulsive wave rather than purely corrective. This scenario allows for the potential of a double correction within wave (II), provided that Copper fails to break above its March 2025 high, and continues to trade below the April 2025 low.

From the April low, Copper completed a 5-wave structure labeled as wave ((1)) of I of (III), followed by a pullback classified as wave ((2)), finalized on May 8th. The following upward movement could represent waves (1) and (2) of ((3)), indicating continued bullish development.

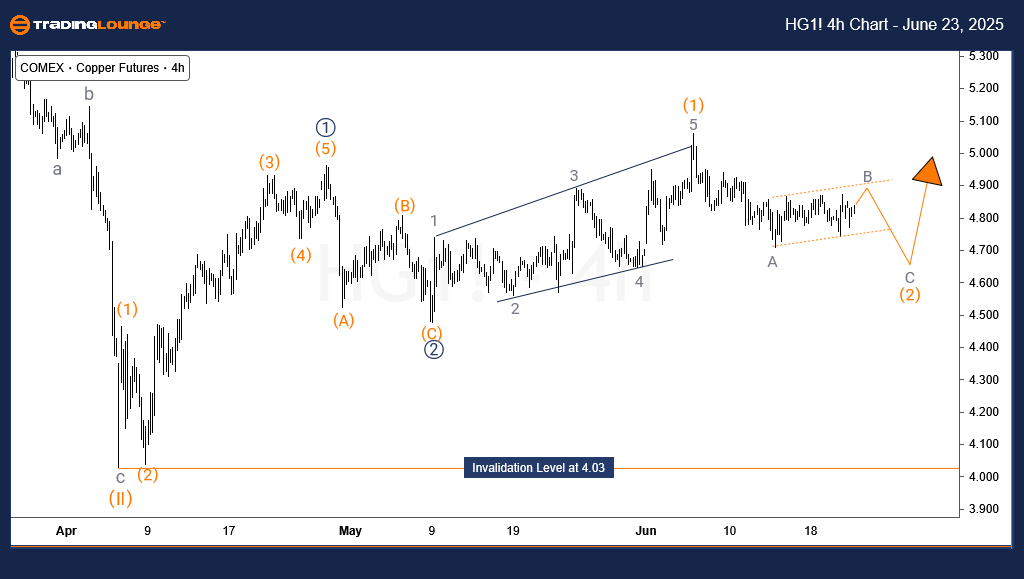
Copper H4 Chart Analysis

On the 4-hour timeframe, Copper appears to be forming wave B of (2), following the conclusion of wave A on June 13th. There is still a possibility of further downside to fully complete wave (2) before the next bullish wave emerges.

As long as Copper holds above the lows from May 9 and especially April 6, the prevailing bullish trend is expected to remain valid. These support levels are critical in maintaining the current Elliott Wave structure and projecting further upward movement in Copper prices.

Technical Analyst: Sanmi Adeagbo

Source: Visit Tradinglounge.com and learn from the Experts. Join TradingLounge Here 

See Previous: Wheat Elliott Wave Technical Analysis

VALUE Offer - $1 for 2 Weeks then $29 a month!Click here

Access 7 Analysts Over 200 Markets Covered. Chat Room With Support

Copper-Commodity-HG1...

Related

Navigating Uptrend Opportunities: Theta Token/ U.S. dollar(THETAUSD) Elliott Wave Analysis

Navigating Uptrend Opportunities: Theta Token/ U.S. dollar(THETAUSD) Elliott Wave Analysis

Our Elliott Wave analysis of THETAUSD suggests a bullish outlook as of February 20, 2024. Both daily...

Read More >
Australian Dollar/U.S. Dollar (AUDUSD) Elliott Wave Analysis: Accurate Currency Forecasts and Forex Technical Insights

Australian Dollar/U.S. Dollar (AUDUSD) Elliott Wave Analysis: Accurate Currency Forecasts and Forex Technical Insights

The AUDUSD Elliott Wave analysis provides a detailed look at the current market trends, focusing on ...

Read More >
Anticipate the Forex Market Movements for the Australian Dollar against the U.S. Dollar: AUDUSD Elliott Wave Technical Analysis

Anticipate the Forex Market Movements for the Australian Dollar against the U.S. Dollar: AUDUSD Elliott Wave Technical Analysis

This analysis covers the AUDUSD pair using Elliott Wave theory, providing key insights into current ...

Read More >
U.S.Dollar/Swiss Franc (USD/CHF)  Forex Elliott Wave Technical  and Currency Pair Analysis

U.S.Dollar/Swiss Franc (USD/CHF)  Forex Elliott Wave Technical and Currency Pair Analysis

This analysis delves into the USD/CHF market dynamics using Elliott Wave theory, providing insights ...

Read More >
Elliott Wave Trading Strategies: SP500, NASDAQ, DAX, ASX – July 10, 2025 Market Forecast

Elliott Wave Trading Strategies: SP500, NASDAQ, DAX, ASX – July 10, 2025 Market Forecast

US indices SP500 and NASDAQ continue rising in Wave v) of 3 of (1), while DAX, FTSE, and ASX prepare...

Read More >
Australian Dollar / Japanese Yen(AUDJPY) 4 Hour and Day Chart Elliott Wave Technical Analysis 12 October 23

Australian Dollar / Japanese Yen(AUDJPY) 4 Hour and Day Chart Elliott Wave Technical Analysis 12 October 23

In summary, the AUD/JPY Elliott Wave Analysis for 12 October 23, offers insights into the ongoing co...

Read More >

$1 for 2 Weeks

then $29 a month!

What a Special Offer!

Trade Recommendations

Unleash the power of deversified trading with our comprehensive portfolio, covering 250+ markets:

  • Stock Trades
  • Crypto Trades
  • Forex Trades
  • Commodity Trades
Elliott Wave Analysis

Gain a competitive edge with expert insights and AI-powered Elliott Wave charting into:

  • Global Indices
  • US Stocks & ASX Stocks
  • Forex & Crypto
  • Commodities
Top-Notch Trading Tools

Equip yourself with the tools of success:

  • Real-time Chat rooms
  • Elliott Wave Algorithm
  • Portfolio tools
  • TradingLevels
  • Screener
  • Trading Game
7 Elliott Wave Analysts

Stay ahead of the market with daily charts and insightful videos
Your secret to strategic trading!

JOIN HERE


Welcome to TradingLounge (ASIC A.R.No. 321187), specialists in trades, trading education and technical analysis, covering stocks, indices, commodities, forex and cryptocurrencies.

When you join TradingLounge you have access to everything we offer, including trade tools, educational content and a social platform to chat with like-minded investors.

Read more

@Copyright 2024 by tradinglounge.com

Contact Us

Australian no: 02 4787 6020

International no: +61 (2) 47876020

Pay with:

Find us on