IBEX 35 (Spain) – Elliott Wave Analysis – Trading Lounge Day Chart
IBEX 35 (Spain) Wave Technical Analysis
Function: Bullish Trend
Mode: Impulsive
Structure: Gray Wave 3
Position: Orange Wave 3
Next Lower Degree: Gray Wave 4
Wave Cancellation Level: 12,054.24
IBEX 35 Elliott Wave Analysis Overview
The IBEX 35 Elliott Wave Analysis on the daily chart indicates a bullish trend, with the market currently in an impulsive phase. The ongoing Gray Wave 3 is part of a larger upward structure within Orange Wave 3, suggesting strong bullish momentum characteristic of an impulsive wave structure. The next anticipated movement is Gray Wave 4, expected to form after Gray Wave 3 concludes.
The previous Gray Wave 2 has likely ended, and the market is now progressing through Gray Wave 3 of Orange Wave 3. Given its impulsive nature, continued bullish strength is expected. Traders should monitor Gray Wave 3 closely, as its completion will signal the onset of Gray Wave 4, a corrective phase that may introduce temporary pullbacks or consolidation before the uptrend resumes.
Key Trading Considerations
Critical Price Level to Watch: 12,054.24 (Wave Cancellation Level)
- A drop below this level invalidates the current wave count, requiring a market structure reassessment.
- This level acts as key support, and its breach could indicate a trend reversal or wave pattern shift.
Market Implications:
- Completion of Gray Wave 3 → Signals a potential entry point for Gray Wave 4, introducing a corrective phase.
- Impulsive Wave Strength → Suggests continued bullish movement until Wave 3 reaches exhaustion.
- Corrective Phase Awareness → Helps traders prepare for retracements before the trend resumes.
Conclusion
The IBEX 35 market structure reflects a strong bullish trend, with Gray Wave 3 forming after Gray Wave 2’s completion. This impulsive movement is part of Orange Wave 3, and the next anticipated development is Gray Wave 4, expected to bring a temporary correction before the broader bullish trend continues.
Traders should closely observe price action around the 12,054.24 level, as this critical support zone acts as a wave validation threshold. If this level holds, the bullish outlook remains intact. However, a break below would require reevaluating the wave count.
Understanding Elliott Wave structures is essential for predicting market movements and adjusting trading strategies accordingly. By analyzing wave formations and price action, traders can make informed decisions to capitalize on market trends.
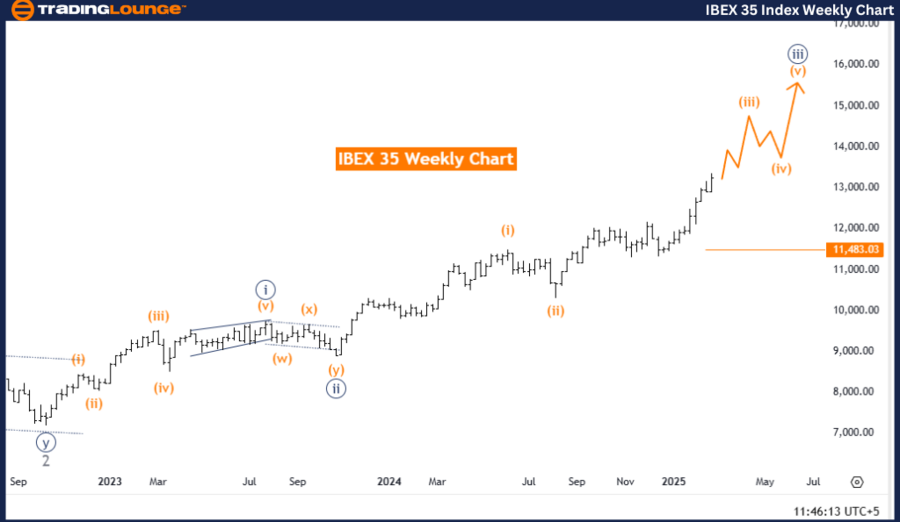
IBEX 35 (Spain) – Elliott Wave Analysis – Trading Lounge Weekly Chart
IBEX 35 (Spain) Wave Technical Analysis
Function: Bullish Trend
Mode: Impulsive
Structure: Orange Wave 3
Position: Navy Blue Wave 3
Next Lower Degree: Orange Wave 4
Wave Cancellation Level: 12,054.24
IBEX 35 Elliott Wave Analysis Overview
The IBEX 35 Elliott Wave Analysis on the weekly chart reflects a bullish trend, with the market currently in an impulsive phase. The ongoing Orange Wave 3 is part of a larger upward structure within Navy Blue Wave 3, indicating strong bullish momentum characteristic of an impulsive Elliott Wave pattern. The next expected movement is Orange Wave 4, anticipated to form after Orange Wave 3 concludes.
The previous Orange Wave 2 has likely completed, and the market is now progressing through Orange Wave 3 of 3. This wave is expected to maintain strong upward momentum, consistent with its impulsive nature. Traders should watch Orange Wave 3 closely, as its completion will indicate the potential start of Orange Wave 4, a corrective phase that may introduce temporary pullbacks or consolidation before the bullish trend resumes.
Key Trading Considerations
Critical Price Level to Watch: 12,054.24 (Wave Cancellation Level)
- A drop below this level invalidates the current Elliott Wave count, requiring a reassessment of market structure.
- This level serves as a major support zone, and a break below may signal a trend reversal or wave structure change.
Market Implications:
- Completion of Orange Wave 3 → Suggests a potential entry point for Orange Wave 4, introducing a short-term correction.
- Impulsive Wave Strength → Indicates continued bullish momentum until Wave 3 completes.
- Corrective Phase Awareness → Helps traders prepare for retracements before the trend resumes.
Conclusion
The IBEX 35 market structure currently reflects a strong bullish trend, with Orange Wave 3 developing after Orange Wave 2’s completion. This impulsive movement is part of Navy Blue Wave 3, and the next anticipated shift is Orange Wave 4, expected to bring a temporary corrective phase before the broader uptrend continues.
Traders should closely monitor the price action around the 12,054.24 level, as this critical support zone serves as a validation threshold for the bullish wave count. If this level holds, the bullish outlook remains intact. However, a break below would require reassessing the Elliott Wave count.
Understanding Elliott Wave principles is crucial for predicting market behavior and optimizing trading strategies. By analyzing wave dynamics and price action, traders can develop a data-driven approach to maximize market positioning.
Technical Analyst: Malik Awais
Source: visit Tradinglounge.com and learn From the Experts Join TradingLounge Here
Previous: NIFTY 50 (India) Elliott Wave Technical Analysis
VALUE Offer - Buy 1 Month & Get 3 Months!Click here
Access 7 Analysts Over 200 Markets Covered. Chat Room With Support