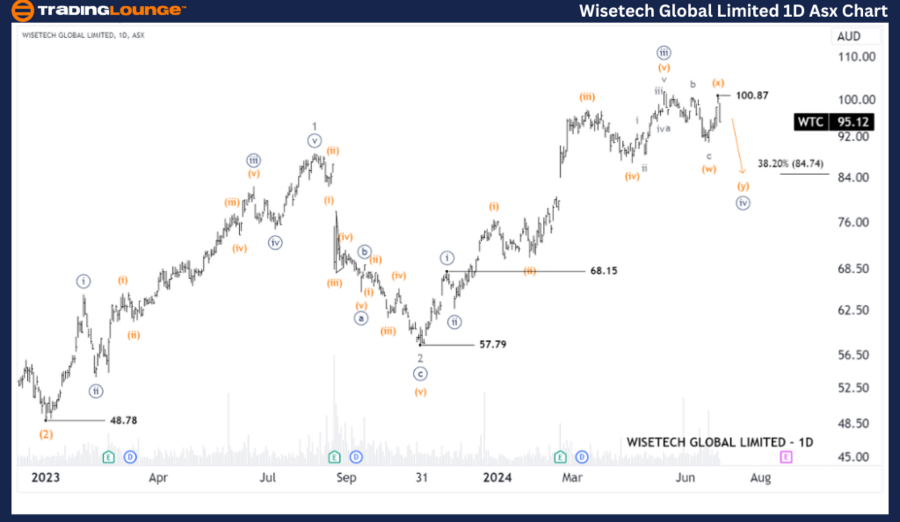
ASX: WISETECH GLOBAL LIMITED - WTC Elliott Wave Technical Analysis TradingLounge (1D Chart)

Greetings, Our Elliott Wave analysis updates the Australian Stock Exchange (ASX) with ASX LIMITED - ASX today. WTC may continue to push lower as wave ((iv))-navy is still developing. Following that, we expect wave ((v))-navy may return to push higher.

ASX: WISETECH GLOBAL LIMITED - WTC Elliott Wave Technical Analysis

ASX: WISETECH GLOBAL LIMITED - WTC 1D Chart (Semilog Scale) Analysis

Function: Major trend (Minor degree, grey)

Mode: Motive

Structure: Impulse

Position: Wave (y)-orange of Wave ((iv))-navy

Details: The short-term outlook shows that wave ((iii))-navy has just ended and wave ((iv))-navy is opening to push lower, the immediate target can find support around 84.74.

Invalidation point: 68.15

Wisetech-Global-ltd-...


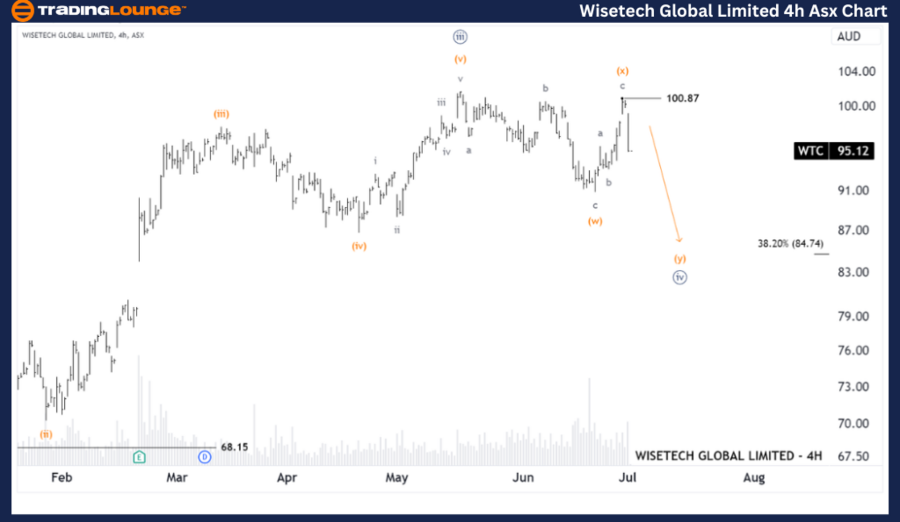
WISETECH GLOBAL LIMITED Elliott Wave Analysis TradingLounge (4-Hour Chart)

ASX: WISETECH GLOBAL LIMITED - WTC Elliott Wave Technical Analysis

ASX: WISETECH GLOBAL LIMITED - WTC 4-Hour Chart Analysis

Function: Major trend (Minute degree, navy)

Mode: Corrective

Structure: Double Zigzag

Position: Wave (y)-orange of Wave ((iv))-navy

Details: Short-term outlook shows wave ((iv))-navy is unfolding to push lower. The price action is developing as Double Zigzag (w),(x),(y)-orange. Wave (y)-orange currently forming is pushing lower, dividing into waves a, b, c-gray. It could target around 84.74.

Invalidation point: 100.87

Technical Analyst: Hua (Shane) Cuong, CEWA-M (Master’s Designation).

Source: visit Tradinglounge.com and learn From the Experts Join TradingLounge Here 

Previous: NATIONAL AUSTRALIA BANK LIMITED - NAB Elliott Wave Technical Analysis

Special Trial Offer - 0.76 Cents a Day for 3 Months! Click here

Access 7 Analysts Over 170 Markets Covered. Chat Room With Support

Wisetech-Global-ltd-...

Conclusion:

Our analysis and forecast of contextual trends, along with the short-term outlook for ASX: WISETECH GLOBAL LIMITED - WTC, aim to provide readers with insights into the current market trends and how to capitalize on them effectively. We offer specific price points that act as validation or invalidation signals for our wave count, enhancing the confidence in our perspective. By combining these factors, we strive to offer readers the most objective and professional perspective on market trends.

Related

TXN Elliott Wave Technical Analysis: Understanding Texas Instruments Inc. Stock Trends and Chart Analysis

TXN Elliott Wave Technical Analysis: Understanding Texas Instruments Inc. Stock Trends and Chart Analysis

Dive into comprehensive TXN Elliott Wave analysis to uncover trends, forecasts, and trading strategi...

Read More >
WTI Elliott Wave Analysis Revealing Crude Oil Price Trends, Key Support Levels, Bearish Breakouts, and Technical Outlook

WTI Elliott Wave Analysis Revealing Crude Oil Price Trends, Key Support Levels, Bearish Breakouts, and Technical Outlook

This analysis delves into WTI crude oil price movements using Elliott Wave theory. It highlights the...

Read More >
Grasim Industries Stocks Elliott Wave Technical Analysis: Insights & Price Targets with Daily and 4H Chart Breakdowns

Grasim Industries Stocks Elliott Wave Technical Analysis: Insights & Price Targets with Daily and 4H Chart Breakdowns

Grasim Industries' Elliott Wave analysis reveals key technical patterns and stock predictions. E...

Read More >
Key Levels and Patterns that Could Impact Visa's Stock Price: Visa Inc. (V) Stocks Elliott Wave Technical Analysis

Key Levels and Patterns that Could Impact Visa's Stock Price: Visa Inc. (V) Stocks Elliott Wave Technical Analysis

Our detailed Elliott Wave analysis for Visa Inc. (V) explores both daily and 1-hour charts to provid...

Read More >
Elliott Wave Analysis and Trading Strategies: SP500, NASDAQ 100, DAX 40, FTSE 100, ASX 200

Elliott Wave Analysis and Trading Strategies: SP500, NASDAQ 100, DAX 40, FTSE 100, ASX 200

The S&P 500 (SPX) and NASDAQ 100 (NDX) are tracking two key Elliott Wave patterns: (1) Wave 4 may ha...

Read More >
Tesla Inc.(TSLA:NASDAQ) Elliott Wave Technical Analysis 18 October 23

Tesla Inc.(TSLA:NASDAQ) Elliott Wave Technical Analysis 18 October 23

Tesla Inc.(TSLA:NASDAQ) Elliott Wave Technical Analysis  TSLA: 1-hour Chart and 4H Chart, 18 October...

Read More >

Buy 1 Month

Get 3 Months!

Special Offer:

Trade Recommendations

Unleash the power of deversified trading with our comprehensive portfolio, covering:

  • Stock Trades
  • Crypto Trades
  • Forex Trades
  • Commodity Trades
Elliott Wave Analysis

Gain a competive edge with expert insights in to:

  • Global Indices
  • US Stocks & ASX Stocks
  • Forex & Crypto
  • Commodities
Top-Notch Trading Tools

Equip yourself with the tools of success:

  • Social Chat
  • Elliott Wave Algorithm
  • Screener
  • TradingLevels
  • Trading Game
7 Elliott Wave Analysts

Stay ahead of the market with daily charts and insightful videos
-Your secret to strategic trading!

JOIN HERE


Welcome to TradingLounge (ASIC A.R.No. 321187), specialists in trades, trading education and technical analysis, covering stocks, indices, commodities, forex and cryptocurrencies.

When you join TradingLounge you have access to everything we offer, including trade tools, educational content and a social platform to chat with like-minded investors.

Read more

@Copyright 2024 by tradinglounge.com

Contact Us

Australian no: 02 4787 6020

International no: +61 (2) 47876020

Pay with:

Find us on