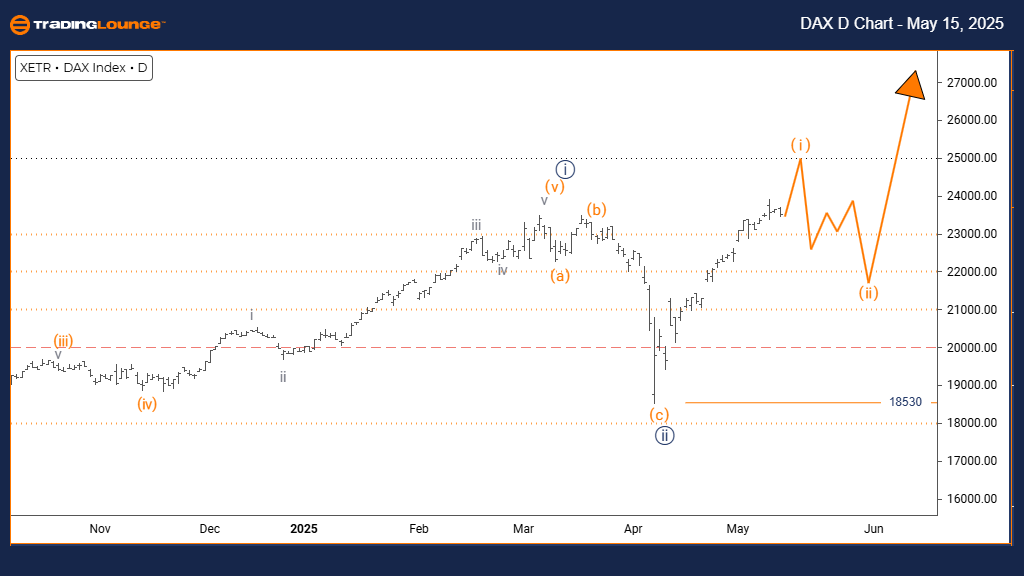
DAX (Germany) Elliott Wave Analysis – Trading Lounge Day Chart
DAX (Germany) Index Day Chart Analysis
DAX (Germany) Elliott Wave Technical Analysis
FUNCTION: Bullish Trend
MODE: Impulsive
STRUCTURE: Orange Wave 1
POSITION: Navy Blue Wave 3
DIRECTION NEXT LOWER DEGREES: Orange Wave 2
DETAILS:
The daily Elliott Wave analysis of the DAX index (Germany) shows a clear bullish trend, supported by an impulsive wave structure. The chart indicates that Orange Wave 1 has started within the broader Navy Blue Wave 3. This suggests that Navy Blue Wave 2 has likely completed, signaling a fresh upward impulse in the market.
This setup points to the beginning of a probable extended rally, with Orange Wave 1 initiating the advance in Navy Blue Wave 3. The conclusion of Wave 2 confirms the start of a new bullish cycle.
The critical wave invalidation level is set at 18530. A break below this point would invalidate the current wave count, suggesting either a deeper correction or a change in trend. The impulsive characteristics of this move support continued bullish sentiment, driven by solid market participation.
Once Orange Wave 1 completes, the market is expected to enter Orange Wave 2, typically a corrective phase. This Elliott Wave count helps traders understand the broader DAX index trend, identifying essential support levels and managing risk around the 18530 threshold.
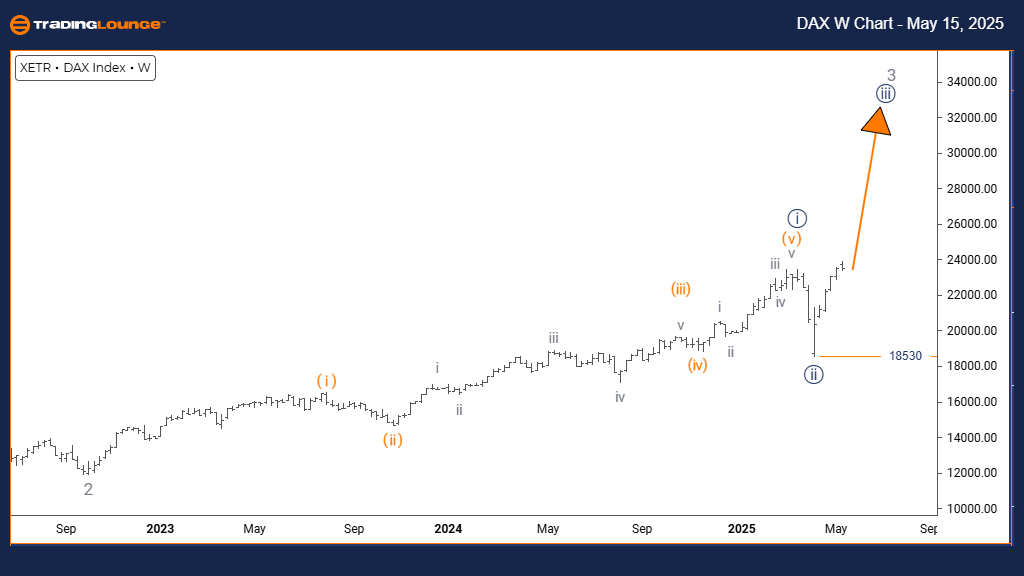
DAX (Germany) Elliott Wave Analysis – Trading Lounge Weekly Chart
DAX (Germany) Elliott Wave Technical Analysis
FUNCTION: Bullish Trend
MODE: Impulsive
STRUCTURE: Navy Blue Wave 3
POSITION: Gray Wave 3
DIRECTION NEXT HIGHER DEGREES: Navy Blue Wave 3 (in progress)
DETAILS:
The weekly Elliott Wave analysis of Germany’s DAX index confirms a strong bullish momentum. The chart reflects an impulsive wave pattern with Navy Blue Wave 3 emerging within Gray Wave 3. With Gray Wave 2 now completed, the market has initiated a new upward phase via Navy Blue Wave 1.
This configuration represents one of the most dynamic segments of an Elliott Wave bullish cycle. The entry into Navy Blue Wave 1 signals the potential start of a significant upward trend.
Market momentum on the weekly timeframe aligns with this bullish outlook, backed by evident buying strength. The wave invalidation point remains at 18530. If breached, it would prompt a reassessment of the wave count or suggest a more complex corrective phase.
This weekly setup serves as a guide for long-term investors tracking the DAX index’s bullish progression. With Navy Blue Wave 1 just underway in Gray Wave 3, the index may continue rising, offering strategic trading opportunities.
Traders should monitor price movements closely, particularly around the 18530 support level, to confirm wave continuity and adjust risk management accordingly.
Technical Analyst: Malik Awais
Source: Visit Tradinglounge.com and learn from the Experts. Join TradingLounge Here
Previous: S&P BSE SENSEX NEXT 50 Elliott Wave Technical Analysis
VALUE Offer - Buy 1 Month & Get 3 Months!Click here
Access 7 Analysts Over 200 Markets Covered. Chat Room With Support