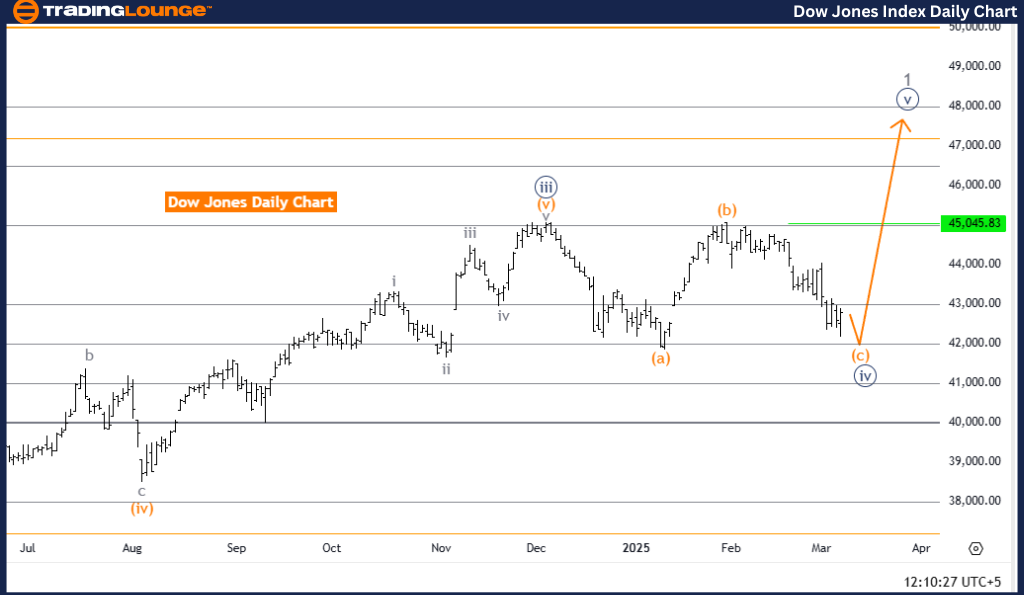
DOW JONES (DJI) Elliott Wave Analysis – Trading Lounge Day Chart
DJI Elliott Wave Technical Analysis
Function: Counter-Trend
Mode: Corrective
Structure: Navy Blue Wave 4
Position: Gray Wave 1
Next Higher Degree Direction: Navy Blue Wave 5
Details: Navy Blue Wave 3 appears to be complete, and Navy Blue Wave 4 is currently forming.
DJI Elliott Wave Analysis – Market Overview
The DOW JONES Industrial Average (DJI) Elliott Wave Analysis on the daily chart signals a corrective phase, confirming a counter-trend movement. The current wave structure positions DJI in Navy Blue Wave 4, a crucial part of the larger correction within Gray Wave 1.
This wave pattern implies that the market is undergoing an intermediate correction before resuming its broader trend. The next expected movement is Navy Blue Wave 5, which will emerge after Navy Blue Wave 4 completes.
Wave Structure & Market Implications
- Navy Blue Wave 3 has concluded, marking a transition into Navy Blue Wave 4.
- Wave 4 is corrective, meaning the market may exhibit sideways or downward movement before the next impulsive wave, Navy Blue Wave 5, starts.
- The completion of Navy Blue Wave 4 is a key event for traders, as it will signal the possible start of Navy Blue Wave 5, aligning with the broader trend direction.
Conclusion
The DOW JONES is in a corrective phase as part of the Elliott Wave structure, with Navy Blue Wave 4 developing after the completion of Navy Blue Wave 3. This correction remains part of Gray Wave 1, and the next anticipated move is Navy Blue Wave 5.
Traders should closely watch the end of Navy Blue Wave 4, as it will provide valuable insights into the market's next direction. This analysis highlights the importance of Elliott Wave Theory in predicting market trends and refining trading strategies.
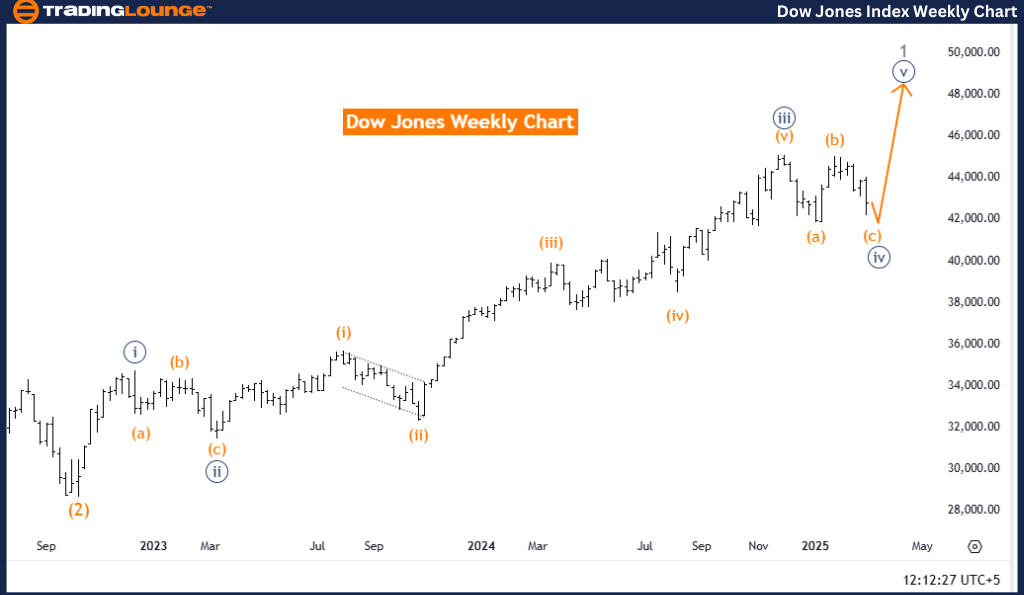
DOW JONES (DJI) Elliott Wave Analysis – Trading Lounge Weekly Chart
DJI Elliott Wave Technical Analysis
Function: Counter-Trend
Mode: Corrective
Structure: Navy Blue Wave 4
Position: Gray Wave 1
Next Higher Degree Direction: Navy Blue Wave 5
Details: Navy Blue Wave 3 appears to be complete, and Navy Blue Wave 4 is currently developing.
DJI Elliott Wave Analysis – Market Overview
The DOW JONES Industrial Average (DJI) Elliott Wave Analysis on the weekly chart reveals a corrective phase, confirming a counter-trend movement. The current wave structure positions DJI in Navy Blue Wave 4, an essential part of the broader correction within Gray Wave 1.
This phase suggests that the market is in an intermediate correction before the broader trend resumes. The next anticipated move is Navy Blue Wave 5, which will emerge after Navy Blue Wave 4 completes.
Wave Structure & Market Implications
- Navy Blue Wave 3 has ended, transitioning the market into Navy Blue Wave 4.
- Wave 4 is corrective, which implies sideways or downward price movement before Navy Blue Wave 5 takes over.
- The completion of Navy Blue Wave 4 is critical for traders, as it will signal the potential start of Navy Blue Wave 5, aligning with the broader trend direction.
Conclusion
The DOW JONES remains in a corrective phase within its Elliott Wave structure, with Navy Blue Wave 4 progressing after the completion of Navy Blue Wave 3. This wave is part of Gray Wave 1, and the next major market movement is expected to be Navy Blue Wave 5.
Traders should closely monitor the conclusion of Navy Blue Wave 4, as it will provide valuable insights into the next price movement. Understanding Elliott Wave structures is crucial for forecasting potential market trends and improving trading strategies.
Technical Analyst: Malik Awais
Source: visit Tradinglounge.com and learn From the Experts Join TradingLounge Here
Previous: S&P/TSX 60 Elliott Wave Technical Analysis
VALUE Offer - Buy 1 Month & Get 3 Months!Click here
Access 7 Analysts Over 200 Markets Covered. Chat Room With Support