CBA Stock Analysis & Elliott Wave Technical Forecast

Greetings, Our Elliott Wave analysis today focuses on the Australian Stock Exchange (ASX) and the Commonwealth Bank of Australia (CBA). Currently, CBA is unfolding in wave 3 (grey) and subdividing into wave ((iii)) (navy), indicating potential for further gains. We are closely monitoring CBA for a long trade setup.

ASX: COMMONWEALTH BANK OF AUSTRALIA (CBA) Elliott Wave Technical Analysis

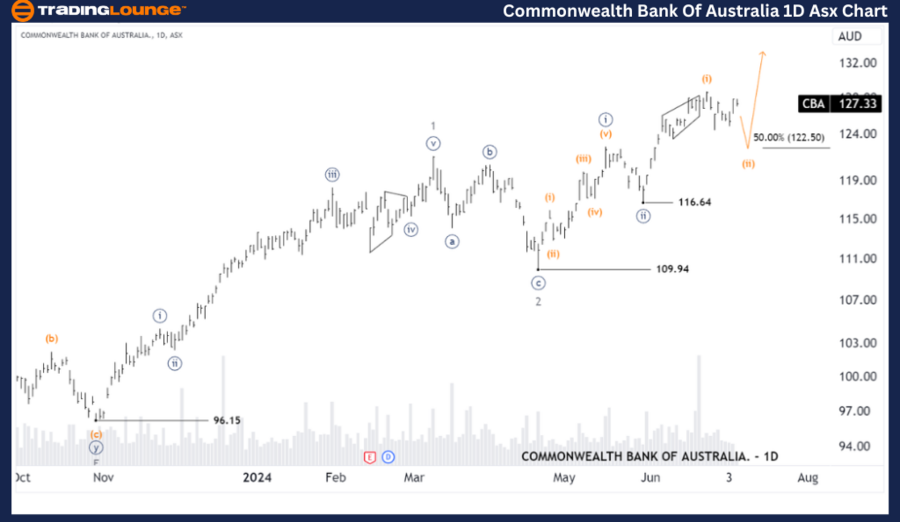
1-Day Chart (Semilog Scale) Analysis

CBA Elliott Wave Technical Analysis

Function: Major trend (Minor degree, grey)

Mode: Motive

Structure: Impulse

Position: Wave (ii) (orange) of Wave ((iii)) (navy) of Wave 3 (grey)

Details:
CBA has completed wave (i) (orange) in a Diagonal form. Now, wave (ii) (orange) is expected to push lower with an immediate target around 122.50. We are watching for a long trade setup.

Invalidation point: 123.40

Commonwealth-bank-of...


ASX: COMMONWEALTH BANK OF AUSTRALIA (CBA) Elliott Wave Technical Analysis

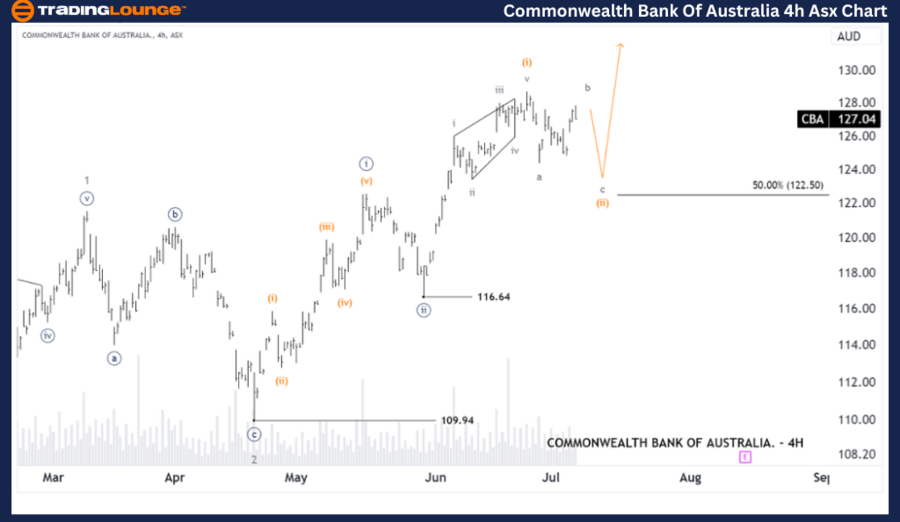
4-Hour Chart Analysis

Function: Major trend (Minuette degree, orange)

Mode: Motive

Structure: Impulse

Position: Wave b (grey) of Wave (ii) (orange) of Wave ((iii)) (navy)

Details:
The short-term outlook shows wave (i) (orange) has ended, and wave (ii) (orange) is unfolding in a Zigzag pattern. Wave b (grey) is nearing completion, followed by wave c (grey), targeting around 122.50. Afterward, wave (ii) (orange) should complete, allowing wave (iii) (orange) to push higher.

Invalidation point: 116.64

Technical Analyst: Hua (Shane) Cuong, CEWA-M (Master’s Designation).

Source: visit Tradinglounge.com and learn From the Experts Join TradingLounge Here 

Previous: ASX LIMITED - ASX Elliott Wave Technical Analysis

Special Trial Offer - 0.76 Cents a Day for 3 Months! Click here

Access 7 Analysts Over 170 Markets Covered. Chat Room With Support

Commonwealth-bank-of...


Conclusion

Our analysis provides insights into the current trends and strategies to capitalize on them. We highlight specific price points for validation or invalidation of our wave count, enhancing confidence in our forecast. This combination offers a professional and objective perspective on market trends.

Related

Elliott Wave BTCUSD Forecast & Swing Strategy: Wave 2 Correction Into Fibonacci Zone for Strategic Bitcoin Trading Opportunities

Elliott Wave BTCUSD Forecast & Swing Strategy: Wave 2 Correction Into Fibonacci Zone for Strategic Bitcoin Trading Opportunities

This post delivers a clear Elliott Wave breakdown for BTCUSD, detailing the current Wave 2 correcti...

Read More >
Berkshire Hathaway (BRK.B) Elliott Wave Analysis, Stock Forecast, Price Prediction, Trend Outlook & Trading Strategy

Berkshire Hathaway (BRK.B) Elliott Wave Analysis, Stock Forecast, Price Prediction, Trend Outlook & Trading Strategy

Berkshire Hathaway (BRK.B) remains in an impulsive uptrend, currently advancing in wave {iii} of 5. ...

Read More >
SBIN Elliott Wave Analysis: Daily Orange Wave 2 Correction & Weekly Navy Blue Wave 5 Impulse – SBI Stock Forecast & Strategy

SBIN Elliott Wave Analysis: Daily Orange Wave 2 Correction & Weekly Navy Blue Wave 5 Impulse – SBI Stock Forecast & Strategy

Elliott Wave analysis of SBI charts reveals a corrective Orange Wave 2 on the daily chart within Nav...

Read More >
Texas Instruments Inc.,  (TXN) Elliott Wave Technical  Analysis: Potential Upside Momentum Signals on Daily and 4-Hour Charts.

Texas Instruments Inc.,  (TXN) Elliott Wave Technical Analysis: Potential Upside Momentum Signals on Daily and 4-Hour Charts.

Dive into Elliott Wave analysis for Texas Instruments Inc. (TXN) unveiling potential upward trends o...

Read More >
Comprehensive Elliott Wave Analysis & Trading Strategies for NASDAQ 100, SP500, and Top Tech Stocks

Comprehensive Elliott Wave Analysis & Trading Strategies for NASDAQ 100, SP500, and Top Tech Stocks

Comprehensive Elliott Wave Analysis & Trading Strategies for NASDAQ 100, SP500, and Top Tech Stocks ...

Read More >
Tata Consultancy Services (TCS) Stock Analysis and TCS Elliott Wave Technical Analysis Provides upport and Resistance Levels

Tata Consultancy Services (TCS) Stock Analysis and TCS Elliott Wave Technical Analysis Provides upport and Resistance Levels

This detailed analysis of Tata Consultancy Services (TCS) explores key technical patterns using Elli...

Read More >

$1 for 2 Weeks

then $29 a month!

What a Special Offer!

Trade Recommendations

Unleash the power of deversified trading with our comprehensive portfolio, covering 250+ markets:

  • Stock Trades
  • Crypto Trades
  • Forex Trades
  • Commodity Trades
Elliott Wave Analysis

Gain a competitive edge with expert insights and AI-powered Elliott Wave charting into:

  • Global Indices
  • US Stocks & ASX Stocks
  • Forex & Crypto
  • Commodities
Top-Notch Trading Tools

Equip yourself with the tools of success:

  • Real-time Chat rooms
  • Elliott Wave Algorithm
  • Portfolio tools
  • TradingLevels
  • Screener
  • Trading Game
7 Elliott Wave Analysts

Stay ahead of the market with daily charts and insightful videos
Your secret to strategic trading!

JOIN HERE


Welcome to TradingLounge (ASIC A.R.No. 321187), specialists in trades, trading education and technical analysis, covering stocks, indices, commodities, forex and cryptocurrencies.

When you join TradingLounge you have access to everything we offer, including trade tools, educational content and a social platform to chat with like-minded investors.

Read more

@Copyright 2024 by tradinglounge.com

Contact Us

Australian no: 02 4787 6020

International no: +61 (2) 47876020

Pay with:

Find us on