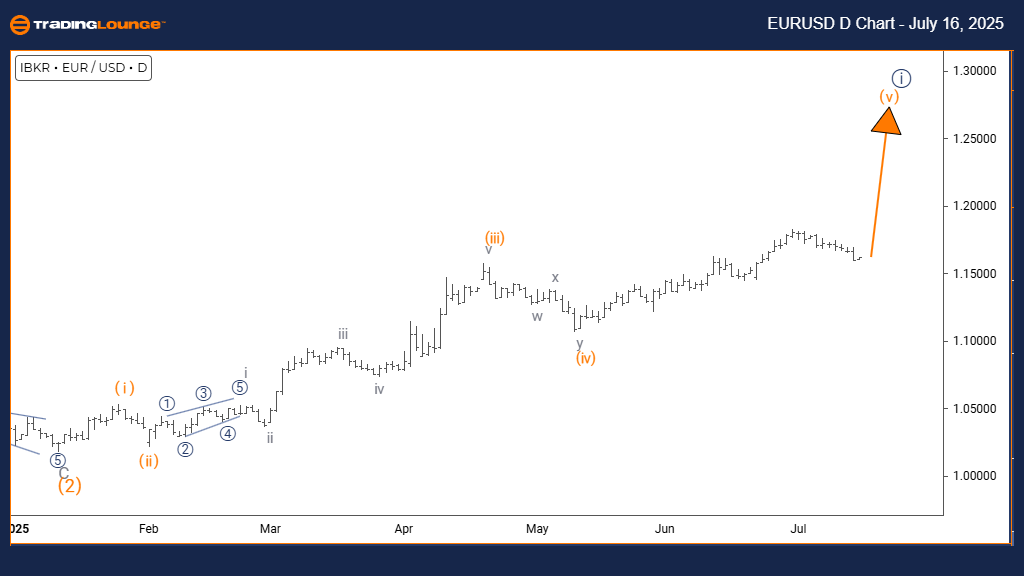
Euro/U.S. Dollar (EURUSD) Elliott Wave Analysis - TradingLounge Daily Chart
EURUSD Elliott Wave Forecast
Function: Bullish Trend
Mode: Impulsive
Structure: Orange Wave 5
Position: Navy Blue Wave 1
Next Direction in Lower Degrees: Navy Blue Wave 2
Details: Completion seen in Orange Wave 4; Orange Wave 5 in progress
Wave Invalid Level: 1.1433
The EURUSD daily chart highlights a bullish Elliott Wave structure, currently progressing through Orange Wave 5 within a larger Navy Blue Wave 1 cycle. With Orange Wave 4 now likely complete, the formation of Wave 5 points to continued upward momentum. This suggests an advanced stage of a five-wave impulsive move.
The ongoing bullish wave shows sustained higher highs, reinforcing the overall trend strength. Because this wave unfolds within Navy Blue Wave 1, the move signals a larger bullish cycle is underway. Upon Wave 5’s completion, traders should anticipate a corrective Navy Blue Wave 2. The key support and invalidation level remains at 1.1433 — a break below would negate this bullish count.
In summary, EURUSD may be approaching the end of its current impulsive wave, hinting at limited upside potential before a retracement. Traders should monitor closely for Wave 5 exhaustion signals, as that would mark the likely start of the next corrective leg. Risk control remains centered around the 1.1433 support level.
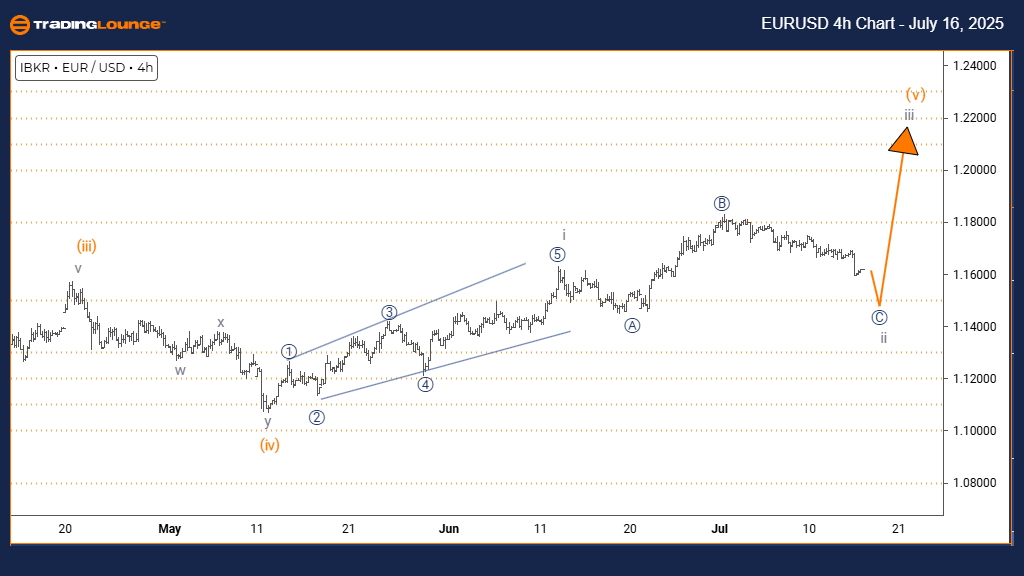
Euro/U.S. Dollar (EURUSD) Elliott Wave Analysis – TradingLounge 4H Chart
EURUSD Elliott Wave Forecast
Function: Counter Trend
Mode: Corrective
Structure: Gray Wave 2
Position: Orange Wave 3
Next Direction in Higher Degrees: Gray Wave 3
Details: Gray Wave 1 is completed; Gray Wave 2 unfolding
Wave Invalid Level: 1.1433
The 4-hour EURUSD Elliott Wave chart shows a corrective phase currently developing. Gray Wave 2 is forming inside the broader Orange Wave 3 move. With Gray Wave 1 already completed, this segment represents a temporary pullback in the prevailing uptrend.
This short-term correction appears moderate or sideways, indicating consolidation. Once Gray Wave 2 completes, Gray Wave 3 should follow, likely resuming the bullish trend. As long as price action stays above 1.1433, the corrective count remains valid. A move below would invalidate the current setup.
Traders should evaluate wave structure closely for early signs of correction exhaustion. This phase is expected to be short-lived before another upward wave begins. Using the 1.1433 invalidation level is essential for effective risk management in this Elliott Wave setup.
Technical Analyst: Malik Awais
Source: Visit Tradinglounge.com and learn from the Experts. Join TradingLounge Here
Previous: GBPAUD Elliott Wave Technical Analysis
VALUE Offer - Buy 1 Month & Get 3 Months!Click here
Access 7 Analysts Over 200 Markets Covered. Chat Room With Support