SPOT Elliott Wave Analysis - Trading Lounge Daily Chart
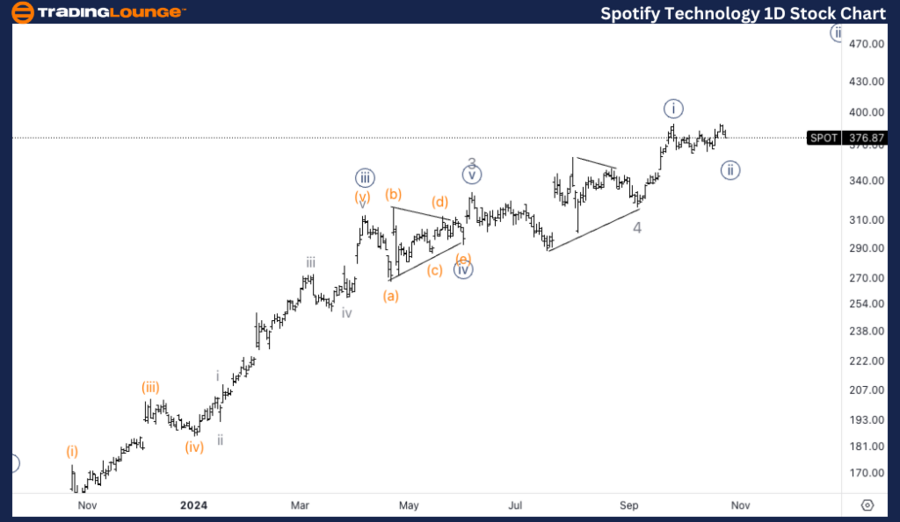
Spotify Technology S.A. (SPOT) - Daily Chart
SPOT Elliott Wave Technical Analysis
Function: Trend
Mode: Impulsive
Structure: Motive
Position: Wave 5 of (1)
Direction: Bullish within wave 5
Details: Current pullbacks are manifesting in a three-wave pattern, keeping the outlook optimistic for further upward movement in Minor wave 5. This progression could aim toward the $500 mark.
Daily Chart Insight: On the daily chart, SPOT is progressing within Minor wave 5 of (1), exhibiting a structured three-wave pullback. This setup supports the continuation of the upward trend, potentially reaching around $500.

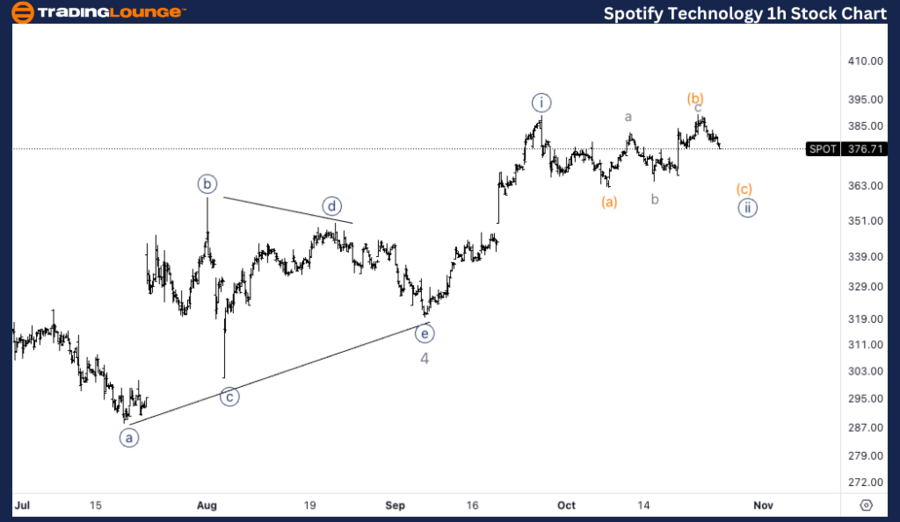
Spotify Technology S.A. (SPOT) - 1H Chart
SPOT Elliott Wave Technical Analysis
Function: Trend
Mode: Impulsive
Structure: Motive
Position: Wave {ii} of 5
Direction: Bottom formation within wave {ii}
Details: The ongoing pattern in wave {ii} indicates it may still be forming, as recent upward movement maintains a three-wave structure. This implies the possibility of one last minor decline before an upward movement resumes in wave {iii} of 5.
1H Chart Insight: The 1-hour chart suggests wave {ii} is likely continuing, with a potential small pullback ahead before resuming the upward trend in wave {iii} of 5.
Technical Analyst: Alessio Barretta
Source: visit Tradinglounge.com and learn From the Experts Join TradingLounge Here
See Previous: Salesforce Inc Elliott Wave Technical Analysis
VALUE Offer - Buy 1 Month & Get 3 Months!Click here
Access 7 Analysts Over 200 Markets Covered. Chat Room With Support

Summary of SPOT Elliott Wave Analysis
This analysis applies Elliott Wave Theory to Spotify Technology S.A. (SPOT) across daily and 1-hour charts, examining current trends to forecast future price directions.