ADI Elliott Wave Analysis Trading Lounge Daily Chart
On April 23, 2024, our trading lounge conducted an extensive Elliott Wave analysis of Analog Devices Inc. (Ticker: ADI), providing a detailed breakdown of its daily and 4-hour chart patterns. This analysis aims to offer precise insights into ADI’s market behaviour, which could assist traders and investors in making more informed trading decisions.
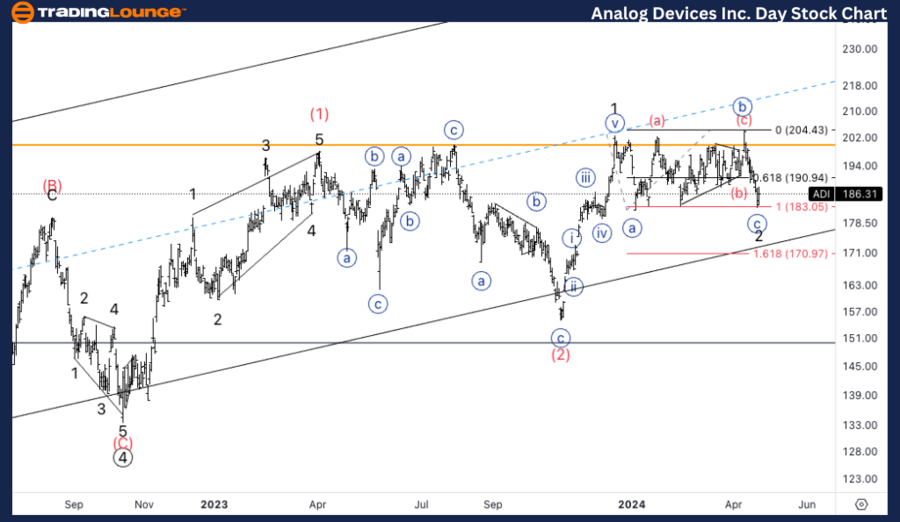
Analog Devices Inc., (ADI) Daily Chart Analysis
ADI Elliott Wave Technical Analysis
Function: Counter Trend
Mode: Corrective
Structure: Flat
Position: Minor wave 2 of (3)
Direction: Bottom in wave 2
Details: As we analyze the daily trading chart for Analog Devices Inc. (ADI), we identify a crucial phase in the Elliott Wave structure. Currently positioned in the minor wave 2 of a larger wave (3), this phase is characterized by its corrective nature. The stock is anticipated to find support around the 180 mark, labelled as MG2. Observations suggest that once support is established at this level, potential long positions could be considered. This is particularly relevant as we await the support confirmation above the TL2, with a target price point set at $200. This setup indicates a counter-trend movement where the bottom of wave 2 is expected to stabilize before advancing into the next growth phase.
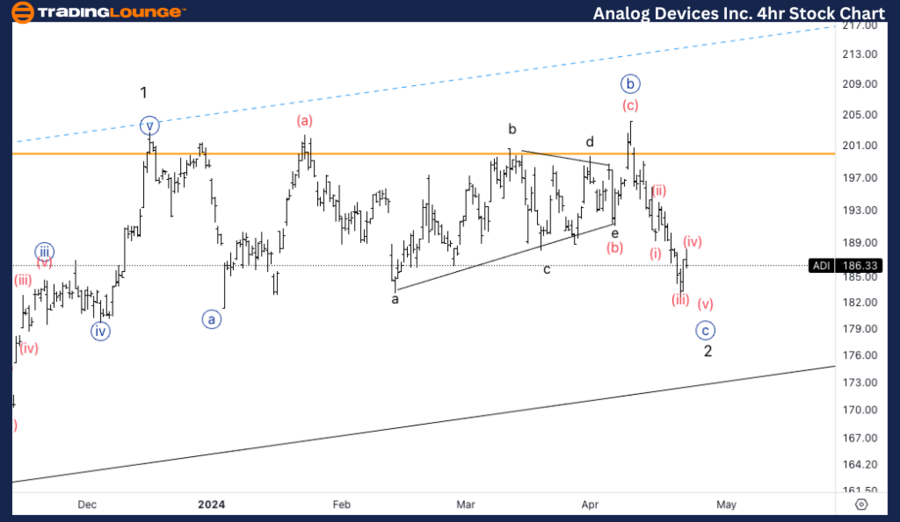
ADI Elliott Wave Analysis Trading Lounge 4Hr Chart,
Analog Devices Inc., (ADI) 4Hr Chart Analysis
ADI Elliott Wave Technical Analysis
Function: Counter Trend
Mode: Corrective
Structure: Flat
Position: Wave {c} of 2
Direction: Bottom in wave 2
Details: Transitioning to a more granular 4-hour chart view of ADI, the stock exhibits similar corrective patterns. The current focus is on wave {c} of 2, marking another significant bottom within wave 2. Reflective of the daily chart's findings, the equality between wave {c} and wave {a} has been touched, indicating a potential setup for another downward leg. This move aims to undercut the lows set by wave {a}, setting the stage for a rebound and subsequent bullish turn. The analysis here underscores the intricate dynamics within the counter-trend movements and highlights the strategic points for traders to watch, aligning with key Elliott Wave principles.
Key Insights and Trading Strategy
When trading ADI using Elliott Wave analysis, the primary strategy involves recognizing the corrective phases within the broader trend dynamics. Both the daily and 4-hour charts reveal that ADI is currently in a flat correction mode, typically associated with volatility and uncertainty short-term but providing strategic entry points for long-term investors.
Traders should monitor these specified levels closely:
- Support Levels: Initial support is anticipated at the $180 mark, with further confirmation required at $200, corresponding with major trendline support (TL2).
- Potential Reversal Points: After potentially dropping below the wave {a} lows, a strategic reversal could offer lucrative long-entry opportunities, especially if other technical indicators align.
Conclusion
In conclusion, the Elliott Wave analysis for Analog Devices Inc. presents a complex yet opportunistic landscape for traders. With the stock navigating through its corrective phases, particularly in minor wave 2 of (3), attention to support and resistance levels becomes crucial. As ADI approaches these critical junctures, both the daily and 4-hour charts serve as essential tools for traders to refine their strategies and optimize entry and exit points, aiming to capitalize on the predictive power of the Elliott Wave theory.
Technical Analyst: Alessio Barretta
Source: visit Tradinglounge.com and learn From the Experts Join TradingLounge Here
See Previous: Visa Inc. (V) Daily Elliott Wave Technical Analysis
TradingLounge's Free Week Extravaganza!
April 14 – 21: Unlock the Doors to Trading Excellence — Absolutely FREE