Elliott Wave Analysis: Daily and 4-Hour Perspectives for Visa Inc.

On April 22, 2024, our Elliott Wave analysis delves into Visa Inc. (Ticker: V), providing valuable insights into its daily and 4-hour chart movements. This analysis aims to offer investors actionable information to navigate the market effectively.

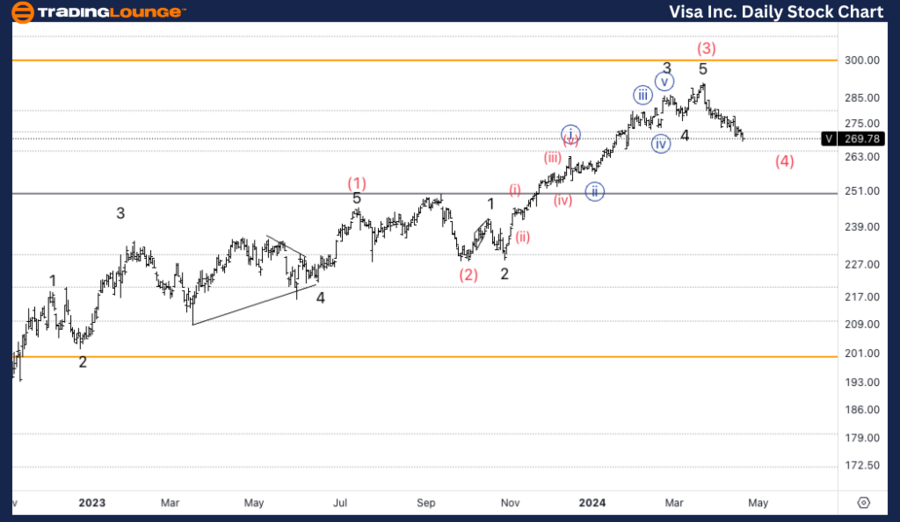
V Elliott Wave Daily Chart Analysis

Visa Inc. (V) Daily Elliott Wave Technical Analysis

Function: Counter Trend

Mode: Corrective

Structure: ZigZag

Position: Intermediate wave (4)

Direction: Bottom in wave (4)

Details: The analysis suggests that Intermediate wave (3) may have concluded, aligning with a correction comparable in scope to wave (2). This observation supports the hypothesis that we are now experiencing an Intermediate wave (4).

V Elliott Wave Technical Analysis – Daily Chart
Our analysis reveals that Visa is currently undergoing a corrective counter-trend phase, characterized by a ZigZag structure, identified as an Intermediate wave (4). The direction indicates a potential bottoming out in wave (4). We are exploring the possibility of Intermediate wave (3) completion, given the correction's magnitude, aligning with a wave (2) of the same degree.

Visa-Inc-1D-Stock-Ch...


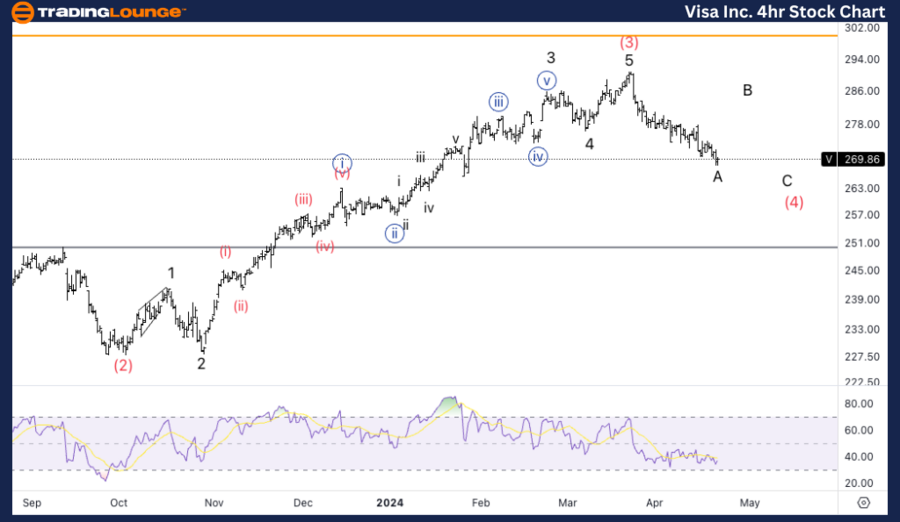
Elliott Wave Analysis for Visa Inc. on 4-Hour Chart

Function: Counter Trend

Mode: Corrective

Structure: ZigZag

Position: Intermediate wave (4)

Direction: Bottom in wave A of (4)

Details: Current assessments are split between a potential conclusion of wave A, indicated by bullish divergence in the RSI, and the possibility of a pronounced wave (4) that provides a contrast to the sideways pattern observed in wave (2).

This revised content simplifies the understanding of Elliott Wave technical analysis for Visa Inc., highlighting key technical positions and potential movements in its stock price based on Elliott Wave principles.

V Elliott Wave Technical Analysis – 4hr Chart

Zooming into the 4-hour chart, Visa's corrective phase continues within Intermediate wave (4), specifically focusing on wave A. Our analysis suggests that the correction may have found a bottom in wave A, supported by the bullish divergence observed in the Relative Strength Index (RSI). Alternatively, there is a possibility of a sharp wave (4) unfolding, alternating with a sideways wave (2) pattern.

Technical Analyst: Alessio Barretta

Source: visit Tradinglounge.com and learn From the Experts Join TradingLounge Here 

See Previous: Super Micro Computer Inc. (SMCI)

TradingLounge's Free Week Extravaganza!

April 14 – 21: Unlock the Doors to Trading Excellence — Absolutely FREE

Visa-Inc-4H-Stock-Ch...

Related

NASDAQ, AAPL, AMZN, NVDA, TSLA, GOOGL, META, NFLX, MSFT. Elliott Wave Insights & Strategies

NASDAQ, AAPL, AMZN, NVDA, TSLA, GOOGL, META, NFLX, MSFT. Elliott Wave Insights & Strategies

Explore Elliott Wave analysis and trading strategies for NASDAQ-listed stocks, including NASDAQ 100,...

Read More >
NASDAQ Elliott Wave Analysis Reveals Wave C Development in Ongoing Orange Wave 4 Correction with Bullish Forecast Toward Wave 5

NASDAQ Elliott Wave Analysis Reveals Wave C Development in Ongoing Orange Wave 4 Correction with Bullish Forecast Toward Wave 5

NASDAQ index using Elliott Wave Theory. It focuses on the ongoing corrective phase identified as Ora...

Read More >
Master the Forex Market: Unveil U.S. Dollar/Japanese Yen (USD/JPY) Trends with Expert USDJPY Elliott Wave Technical Analysis

Master the Forex Market: Unveil U.S. Dollar/Japanese Yen (USD/JPY) Trends with Expert USDJPY Elliott Wave Technical Analysis

This article provides a thorough USD/JPY Elliott Wave analysis, covering both daily and 4-hour chart...

Read More >
NVIDIA Corp.(NVDA) Stock Elliott Wave Technical Analysis : Market analysis shows NVDA Stock performance.

NVIDIA Corp.(NVDA) Stock Elliott Wave Technical Analysis : Market analysis shows NVDA Stock performance.

This detailed analysis leverages the Elliott Wave Theory to provide a deep dive into NVIDIA Corporat...

Read More >
Cocoa Elliott Wave Technical Analysis: Key Price Trends, Bullish Trends, Wave Structures, and Market Insights for Record Highs in 2025

Cocoa Elliott Wave Technical Analysis: Key Price Trends, Bullish Trends, Wave Structures, and Market Insights for Record Highs in 2025

Elliott Wave analysis of Cocoa prices, highlighting key technical trends, wave structures, and price...

Read More >
WiseTech Global (ASX: WTC) Elliott Wave Analysis: Bullish Wave 5 Breakout & Stock Forecast Indicating an Uptrend in Share Price

WiseTech Global (ASX: WTC) Elliott Wave Analysis: Bullish Wave 5 Breakout & Stock Forecast Indicating an Uptrend in Share Price

Our Elliott Wave analysis of WiseTech Global (ASX: WTC) highlights a potential Wave 5 breakout, indi...

Read More >

$1 for 2 Weeks

then $29 a month!

What a Special Offer!

Trade Recommendations

Unleash the power of deversified trading with our comprehensive portfolio, covering 250+ markets:

  • Stock Trades
  • Crypto Trades
  • Forex Trades
  • Commodity Trades
Elliott Wave Analysis

Gain a competitive edge with expert insights and AI-powered Elliott Wave charting into:

  • Global Indices
  • US Stocks & ASX Stocks
  • Forex & Crypto
  • Commodities
Top-Notch Trading Tools

Equip yourself with the tools of success:

  • Real-time Chat rooms
  • Elliott Wave Algorithm
  • Portfolio tools
  • TradingLevels
  • Screener
  • Trading Game
7 Elliott Wave Analysts

Stay ahead of the market with daily charts and insightful videos
Your secret to strategic trading!

JOIN HERE


Welcome to TradingLounge (ASIC A.R.No. 321187), specialists in trades, trading education and technical analysis, covering stocks, indices, commodities, forex and cryptocurrencies.

When you join TradingLounge you have access to everything we offer, including trade tools, educational content and a social platform to chat with like-minded investors.

Read more

@Copyright 2024 by tradinglounge.com

Contact Us

Australian no: 02 4787 6020

International no: +61 (2) 47876020

Pay with:

Find us on