23Oct

Providing a Well-Rounded View of Salesforce's Stock Performance and Forecast: Salesforce Inc (CRM) Elliott Wave Analysis

Salesforce Inc. (CRM) Elliott Wave Analysis: Current Trend Overview

This analysis examines Salesforce Inc.'s (CRM) current trend structure using Elliott Wave Theory, covering both daily and 1-hour charts. The following breakdown highlights CRM's stock position and its potential future movements.

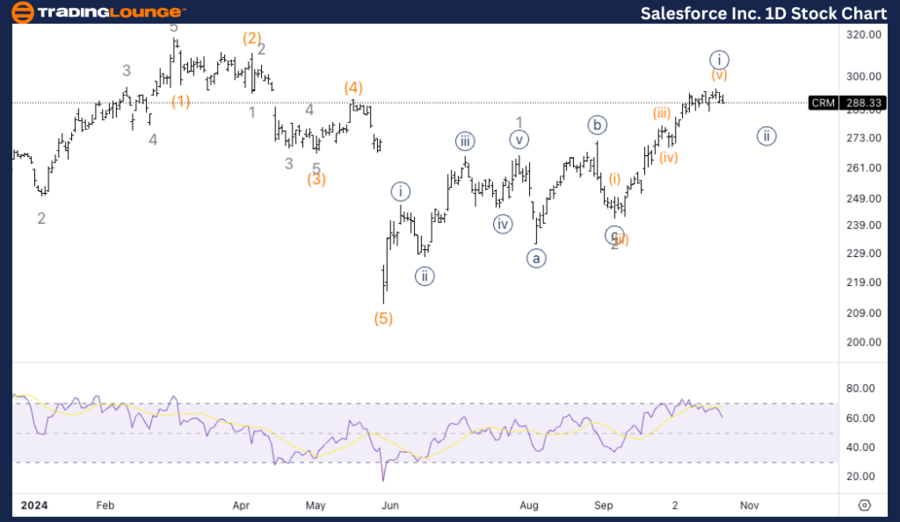
CRM Elliott Wave Analysis - TradingLounge Daily Chart Overview

Salesforce Inc. (CRM) Daily Chart

CRM Elliott Wave Technical Analysis

  • Function: Trend

  • Mode: Impulsive

  • Structure: Motive

  • Position: Minute wave {iii}

  • Direction: Upside in wave {iii}

Details: Salesforce (CRM) shows a potential bottom forming above $200. The stock is expected to rise within wave 3, signaling further upward movement as the current impulsive wave structure continues to unfold.

CRM Elliott Wave Technical Analysis – Daily Chart Breakdown

On the daily chart, Salesforce (CRM) may have established a key bottom above $200. The current Elliott wave structure suggests that the stock is in the early phases of wave {iii}, which is part of a larger impulsive pattern. As wave 3 progresses, there is potential for significant upside momentum.

Salesforce-Inc-1D-St...


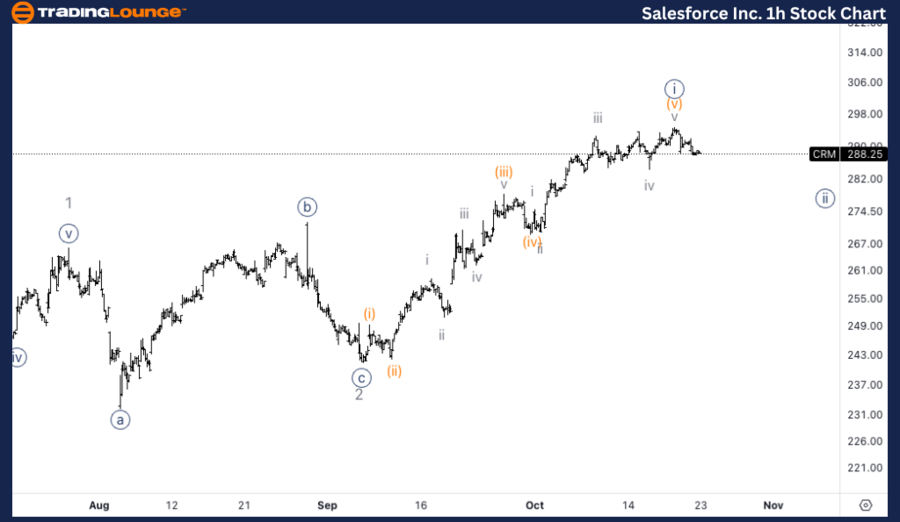
Salesforce Inc. (CRM) 1-Hour Chart Analysis

CRM Elliott Wave Technical Analysis

  • Function: Trend

  • Mode: Impulsive

  • Structure: Motive

  • Position: Wave {i} of 3

  • Direction: Approaching top in wave {i}

Details: As Salesforce approaches the top of wave {i} of 3, the Relative Strength Index (RSI) indicates overbought conditions. The stock is nearing TradingLevel3 at $300, and a pullback is likely. Following this retracement, a ClassicTradingLevelPattern may emerge, supporting continued upward movement in wave {iii} of 3.

CRM Elliott Wave Technical Analysis – 1-Hour Chart Breakdown

On the 1-hour chart, Salesforce is nearing the completion of wave {i} of 3. The RSI shows signs of a potential short-term top as the stock price approaches TradingLevel3 at $300. A retracement may occur, forming a ClassicTradingLevelPattern. After this pullback, the upward trend is expected to resume within wave {iii} of 3.

Technical Analyst: Alessio Barretta

Source: visit Tradinglounge.com and learn From the Experts Join TradingLounge Here 

See Previous: The Coca-Cola Company Elliott Wave Technical Analysis

VALUE Offer - Buy 1 Month & Get 3 Months!Click here

Access 7 Analysts Over 200 Markets Covered. Chat Room With Support

Salesforce-Inc-1h-St...

Related

U.S.Dollar/Japanese Yen (USDJPY) Elliott Wave Technical Analysis 18 December 23

U.S.Dollar/Japanese Yen (USDJPY) Elliott Wave Technical Analysis 18 December 23

USDJPY Elliott Wave Analysis Trading Lounge Day and 4-Hour Chart dated 18 December 23, delves into t...

Read More >
Highlighting the Future Price Trend of VeChain Cryptocurrency Pair: VETUSD Elliott Wave Technical Analysis

Highlighting the Future Price Trend of VeChain Cryptocurrency Pair: VETUSD Elliott Wave Technical Analysis

This article provides an in-depth Elliott Wave analysis for VeChain (VETUSD), highlighting the curre...

Read More >
Shanghai Composite Index Elliott Wave Technical Analysis: Focusing on Corrective Waves, Market Trends, and Future Price Predictions

Shanghai Composite Index Elliott Wave Technical Analysis: Focusing on Corrective Waves, Market Trends, and Future Price Predictions

This article provides a detailed Elliott Wave analysis of the Shanghai Composite Index, focusing on ...

Read More >
ADANI GREEN Elliott Wave Analysis, Stock Forecast, Price Prediction, Technical Analysis, Market Trends & Trading Strategy

ADANI GREEN Elliott Wave Analysis, Stock Forecast, Price Prediction, Technical Analysis, Market Trends & Trading Strategy

ADANI GREEN Elliott Wave analysis covering daily and weekly stock trends. This report provides techn...

Read More >
Forex Analysis of Euro/U.S. Dollar EURUSD Using Elliott Wave Theory Provides Insights into the Current Market Trends

Forex Analysis of Euro/U.S. Dollar EURUSD Using Elliott Wave Theory Provides Insights into the Current Market Trends

This detailed analysis of EURUSD using Elliott Wave Theory provides insights into the current market...

Read More >
JP Morgan Stock Analysis: Elliott Wave Insights, Price Targets, Daily and Hourly Chart Breakdown, and Trading Strategies

JP Morgan Stock Analysis: Elliott Wave Insights, Price Targets, Daily and Hourly Chart Breakdown, and Trading Strategies

This comprehensive analysis of JP Morgan & Chase Co. explores the stock's Elliott Wave patterns,...

Read More >

Buy 1 Month

Get 3 Months!

Special Offer:

Trade Recommendations

Unleash the power of deversified trading with our comprehensive portfolio, covering:

  • Stock Trades
  • Crypto Trades
  • Forex Trades
  • Commodity Trades
Elliott Wave Analysis

Gain a competive edge with expert insights in to:

  • Global Indices
  • US Stocks & ASX Stocks
  • Forex & Crypto
  • Commodities
Top-Notch Trading Tools

Equip yourself with the tools of success:

  • Social Chat
  • Elliott Wave Algorithm
  • Screener
  • TradingLevels
  • Trading Game
7 Elliott Wave Analysts

Stay ahead of the market with daily charts and insightful videos
-Your secret to strategic trading!

JOIN HERE


Welcome to TradingLounge (ASIC A.R.No. 321187), specialists in trades, trading education and technical analysis, covering stocks, indices, commodities, forex and cryptocurrencies.

When you join TradingLounge you have access to everything we offer, including trade tools, educational content and a social platform to chat with like-minded investors.

Read more

@Copyright 2024 by tradinglounge.com

Contact Us

Australian no: 02 4787 6020

International no: +61 (2) 47876020

Pay with:

Find us on