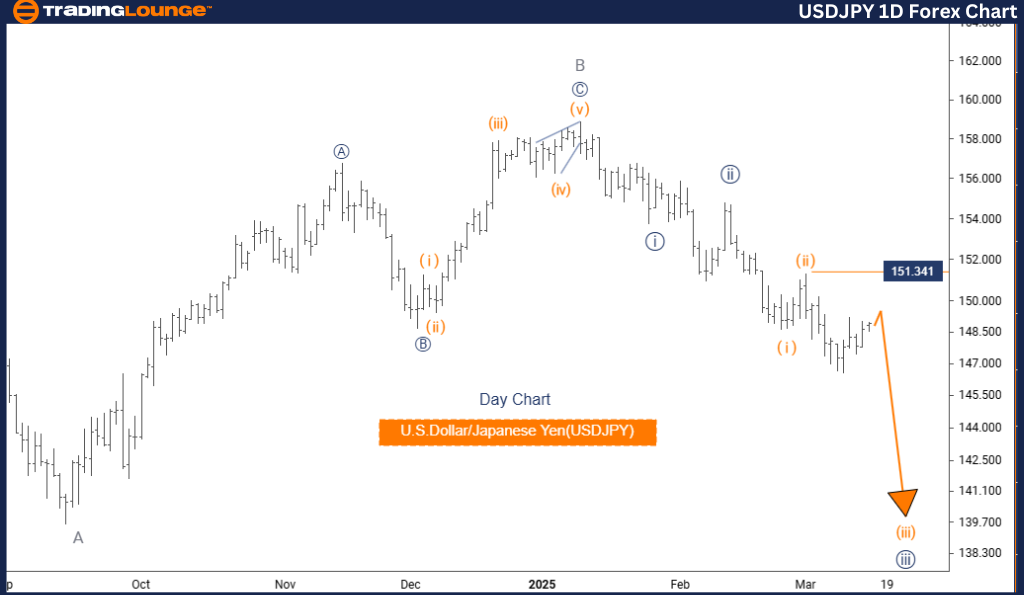
U.S. Dollar / Japanese Yen (USDJPY) Elliott Wave Analysis – Trading Lounge Daily Chart Analysis
USDJPY Elliott Wave Technical Analysis
Trend Direction: Bearish
Wave Mode: Impulsive
Current Wave Structure: Orange Wave 3
Wave Position: Navy Blue Wave 3
Next Higher Degree Wave: Orange Wave 4
Invalidation Level: 151.341
Analysis & Market Outlook
The USDJPY Elliott Wave daily chart analysis provides an insightful view of the U.S. Dollar/Japanese Yen currency pair, focusing on current market movements and upcoming trends.
- The market remains in a strong bearish phase, exhibiting impulsive movements rather than corrective fluctuations.
- The dominant structure in play is Orange Wave 3, forming part of a larger Navy Blue Wave 3 framework.
- With Orange Wave 2 already completed, the market is now transitioning into Orange Wave 3, which is expected to gain momentum before the emergence of the next key trend.
- The next critical phase to watch is Orange Wave 4, anticipated to follow once Orange Wave 3 reaches completion.
- A major invalidation level at 151.341 serves as a key reference point. If the price surpasses this threshold, the current Elliott Wave count would be invalidated, potentially altering the broader market outlook.
Trading Strategy & Key Takeaways
This USDJPY daily chart analysis presents a structured approach to identifying market movements and planning future trades:
- A broader perspective on price action helps traders align strategies with long-term trends.
- Monitoring wave structures enables traders to anticipate key market shifts and adjust positions accordingly.
- Understanding the completion of one wave and the beginning of another is crucial for timing market entries and exits effectively.
By leveraging Elliott Wave principles, traders can enhance their decision-making and remain prepared for potential trend reversals.
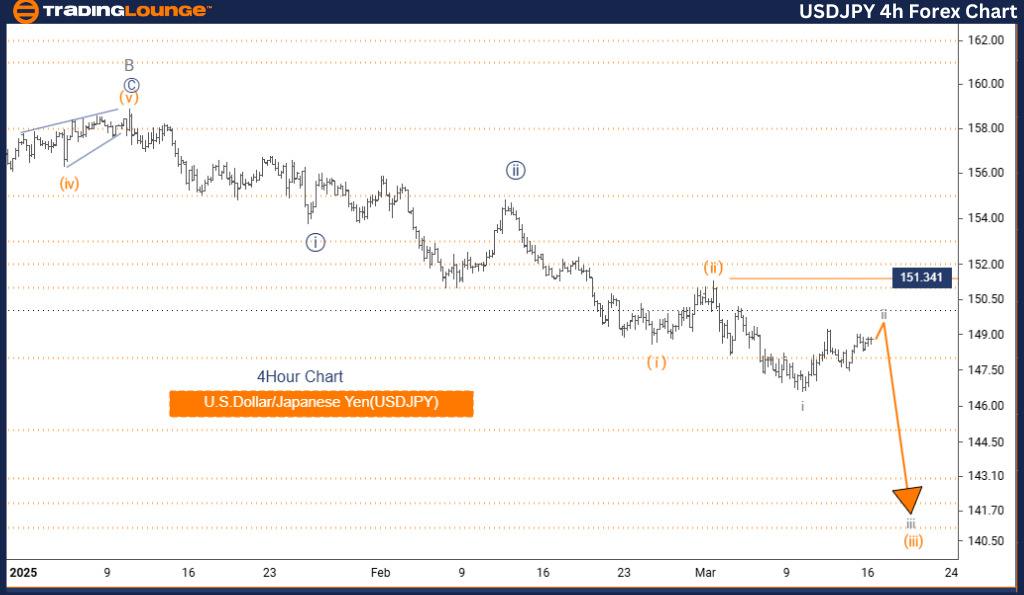
U.S. Dollar / Japanese Yen (USDJPY) Elliott Wave Analysis – Trading Lounge 4-Hour Chart Analysis
USDJPY Elliott Wave Technical Analysis
Trend Direction: Counter-Trend
Wave Mode: Corrective
Current Wave Structure: Gray Wave 2
Wave Position: Orange Wave 3
Next Lower Degree Wave: Gray Wave 3
Invalidation Level: 151.341
Analysis & Market Outlook
The USDJPY Elliott Wave 4-hour chart provides a short-term perspective on market behavior, helping traders refine their strategies based on shorter timeframes.
- The market is in a counter-trend phase, characterized by corrective movements rather than a strong directional trend.
- The current wave structure is Gray Wave 2, forming part of a larger corrective sequence.
- Following the completion of Gray Wave 1, the market is now shifting into Gray Wave 2.
- This phase is expected to be corrective, leading to sideways price action or retracements before the emergence of the next major move.
- Gray Wave 3 is the next anticipated phase, expected to develop once Gray Wave 2 is fully formed.
- A critical invalidation level at 151.341 remains a key price point. If the market exceeds this level, it would signal a break in the current Elliott Wave structure, potentially leading to a trend shift.
Trading Strategy & Key Takeaways
This USDJPY 4-hour chart analysis is valuable for traders looking to navigate shorter-term market trends effectively:
- The 4-hour timeframe offers a more granular view of price movements, allowing traders to make quicker strategic adjustments.
- Recognizing the transitions between corrective and impulsive waves helps traders prepare for potential breakout opportunities.
- The wave-based analysis enables traders to fine-tune their strategies and position themselves ahead of market shifts.
By combining Elliott Wave analysis with key price levels, traders can maximize their market insights and optimize their trading decisions.
Technical Analyst: Malik Awais
Source: Visit Tradinglounge.com and learn from the Experts Join TradingLounge Here
Previous: EURUSD Elliott Wave Technical Analysis
VALUE Offer - Buy 1 Month & Get 3 Months!Click here
Access 7 Analysts Over 200 Markets Covered. Chat Room With Support