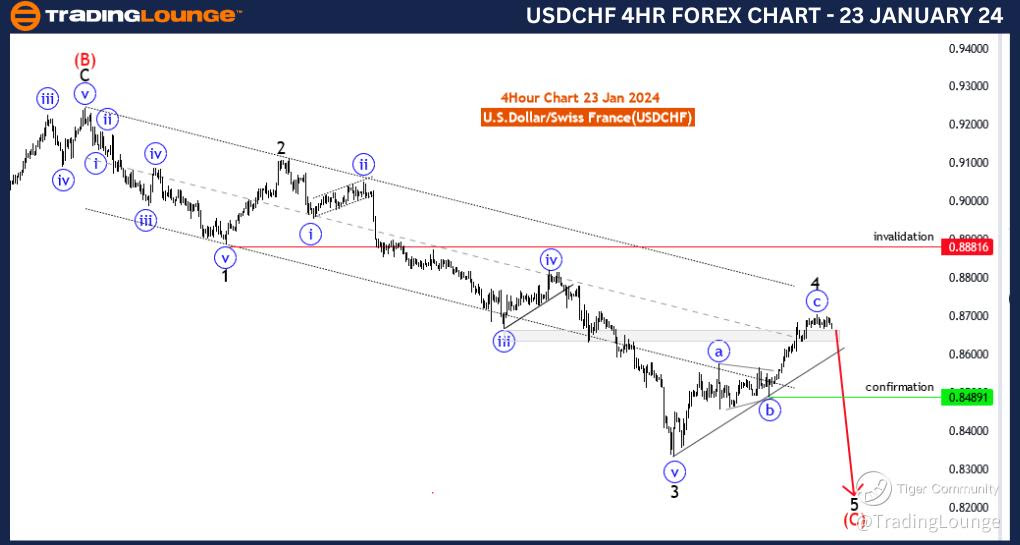
USDCHF Elliott Wave Analysis Trading Lounge 4 Hour Chart, 23 January 24
U.S.Dollar/Swiss Franc(USDCHF) 4 Hour Chart
USDCHF Elliott Wave Technical Analysis
Function: Trend
Mode: impulsive
Structure: sub waves of black wave 5
Position: Red wave C
Direction Next Lower Degrees: black wave 5(started)
Details: black wave 4 looking completed at 0.87062 . Now black wave 5 is in play . Wave Cancel invalid level: 0.88816
The "USDCHF Elliott Wave Analysis Trading Lounge 4 Hour Chart" dated 23 January 24, provides a detailed analysis of the U.S. Dollar/Swiss Franc (USDCHF) currency pair using Elliott Wave theory, a technical approach that aims to identify recurring wave patterns in financial markets for predictive purposes.
The declared "Function" in this analysis is "Trend," indicating a primary focus on understanding and capturing the current direction of the market. This suggests that the analyst is interested in identifying and capitalizing on the prevailing trend.
The identified "Mode" is "Impulsive," signaling that the market is currently in a phase characterized by strong, directional moves. Impulsive waves typically consist of five sub waves, labeled 1, 2, 3, 4, 5, with waves 1, 3, and 5 representing the directional phases.
The specified "Structure" involves the examination of "sub waves of black wave 5." This indicates a detailed analysis of the internal sub waves within the larger structure of black wave 5, providing a more nuanced understanding of the ongoing trend.
The "Position" is defined as "Red wave C," suggesting the current phase within the Elliott Wave count. Red wave C is a subwave within the broader structure of black wave 5.
Regarding "Direction Next Lower Degrees," the focus is on the initiation of "black wave 5 (started)." This implies that the analyst anticipates the commencement of the fifth major wave within the larger degree structure.
The "Details" section highlights that "black wave 4 looking completed at 0.87062," indicating the conclusion of the fourth corrective wave within the broader trend. The implication is that the market is now transitioning into the impulsive phase of black wave 5.
The "Wave Cancel invalid level" is identified as "0.88816." This level serves as a critical reference point, indicating that a breach of this level could invalidate the current wave count, necessitating a reassessment of the analysis and potentially signaling a change in the anticipated market direction.
In summary, the USDCHF Elliott Wave Analysis for the 4-hour chart on 23 January 24, points to an impulsive trend, with black wave 4 concluded and the initiation of black wave 5. Traders are advised to closely monitor the market, with particular attention to the invalidation level at 0.88816.
Technical Analyst: Malik Awais
Source: Tradinglounge.com get trial here!
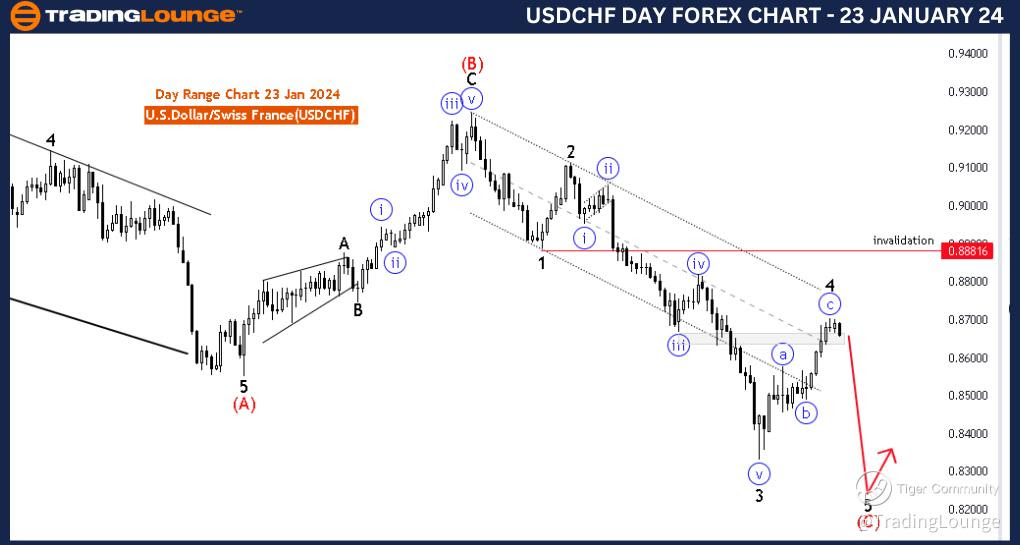
USDCHF Elliott Wave Analysis Trading Lounge Day Chart, 23 January 24
U.S.Dollar/Swiss Franc(USDCHF) Day Chart
USDCHF Elliott Wave Technical Analysis
Function: Trend
Mode: impulsive
Structure: sub waves of black wave 5
Position: Red wave C
Direction Next Lower Degrees: black wave 5(started)
Details: black wave 4 looking completed at 0.87062 . Now black wave 5 is in play. Wave Cancel invalid level: 0.88816
The "USDCHF Elliott Wave Analysis Trading Lounge Day Chart" for 23 January 24, delves into the intricacies of the U.S. Dollar/Swiss Franc (USDCHF) currency pair, utilizing the Elliott Wave theory to discern potential market movements.
The declared "Function" is "Trend," emphasizing a focus on understanding and navigating the existing market direction. This suggests an intent to identify and capitalize on the prevailing trend.
The identified "Mode" is "Impulsive," indicating a phase characterized by strong, directional movements. In Elliott Wave terms, impulsive waves typically consist of five sub waves, labeled 1, 2, 3, 4, 5, with waves 1, 3, and 5 representing the primary directional phases.
The specified "Structure" involves the scrutiny of "sub waves of black wave 5," highlighting a meticulous examination of the internal subwave patterns within the broader structure of black wave 5. This provides a detailed understanding of the ongoing trend.
The "Position" is defined as "Red wave C," indicating the current phase within the Elliott Wave count. Red wave C is a subwave within the larger structure of black wave 5.
Regarding "Direction Next Lower Degrees," the focus is on the initiation of "black wave 5 (started)." This implies that the analyst anticipates the commencement of the fifth major wave within the broader degree structure.
In the "Details" section, it is noted that "black wave 4 looking completed at 0.87062," signaling the conclusion of the fourth corrective wave within the larger trend. The suggestion is that the market is transitioning into the impulsive phase of black wave 5.
The "Wave Cancel invalid level" is identified as "0.88816." This level serves as a crucial reference point, signifying that a breach of this level could invalidate the current wave count, prompting a reassessment of the analysis and potentially indicating a change in the anticipated market direction.
In summary, the USDCHF Elliott Wave Analysis for the daily chart on 23 January 24, highlights an impulsive trend, with black wave 4 concluded and the initiation of black wave 5. Traders are advised to monitor the market closely, with a keen eye on the invalidation level at 0.88816.
Technical Analyst: Malik Awais
Source: Tradinglounge.com get trial here!
Previous: AUDUSD