Iron Ore Elliott Wave Analysis
The SGX TSI Iron Ore Index is a pivotal benchmark in the iron ore market, widely utilized by traders, miners, and steelmakers to facilitate contract settlements and manage price volatility. This index, derived from real-time spot market transactions, is considered a reliable indicator of market conditions and trends.
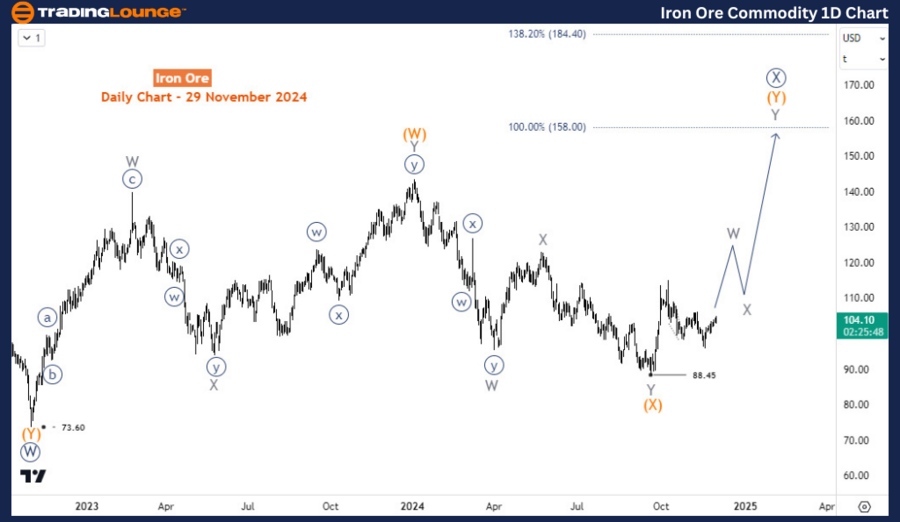
The index reached an all-time high of approximately $233 per dry metric ton in May 2021, propelled by robust Chinese demand and supply chain disruptions. However, this peak signaled the start of a major correction, with the index plunging over 68% to $73 by October 2022. A recovery ensued, pushing the index to $143.5 by December 2023. In 2024, however, the recovery faltered as the index fell nearly 50% before showing a resurgence in September, only to relinquish nearly half those gains by October.
Iron Ore Daily Chart Analysis
A double zigzag pattern appears to be forming from the October 2022 low. Waves (W) and (X) concluded in January 2024 and September 2024, respectively. Consequently, wave (Y) began at 88.45 and holds the potential to extend up to 158 in the weeks or months ahead.

Iron Ore H4 Chart Analysis
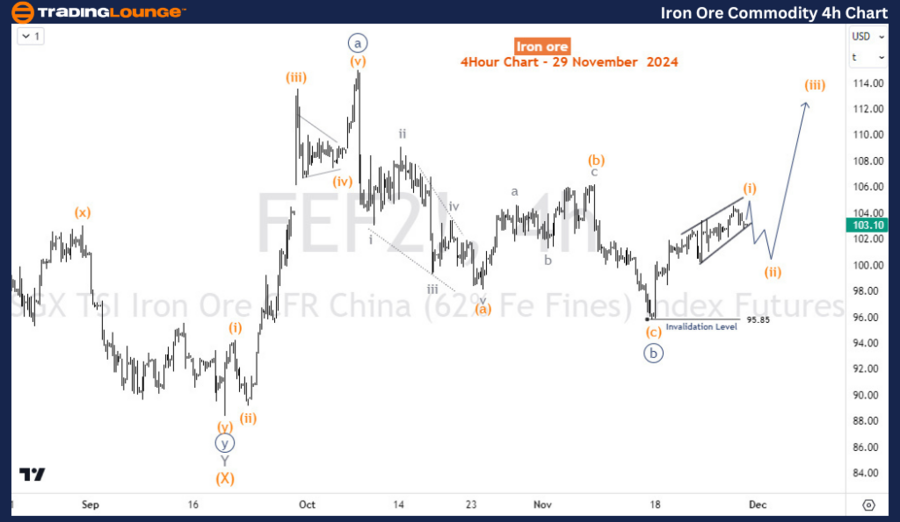
On the H4 chart, the price formed a 5-wave rally to complete wave ((a)) of W of (Y), followed by a pullback to 95.85, marking the end of wave ((b)). Wave ((c)) of W is currently underway and may extend to 122.6. As long as pullbacks remain above 95.85, further upside momentum is anticipated in the coming days.
Technical Analyst: Sanmi Adeagbo
Source: visit Tradinglounge.com and learn From the Experts Join TradingLounge Here
See Previous: Corn Elliott Wave Technical Analysis
VALUE Offer - Buy 1 Month & Get 3 Months!Click here
Access 7 Analysts Over 200 Markets Covered. Chat Room With Support
