Corn Elliott Wave Technical Analysis

The analysis of corn price action continues to indicate a bearish outlook, especially while resistance holds below the $475 mark. The ongoing bearish sequence, which began in April 2022, seems to be correcting the prior impulse rally from April 2020 to April 2022.

Corn Long-Term View

Corn prices remain in a long-term bearish corrective phase that started in July 2012. This phase is part of a broader correction of the diagonal 5-wave sequence initiated in the 1970s. Corrective patterns, excluding triangles, generally consist of three waves:

  • Wave 1: Completed in April 2020 after an extended decline.
  • Wave 2: Marked by strong upward rallies, peaking in April 2022.

The current decline, which began in April 2022, likely represents Wave 3. Projections suggest this wave could extend toward the $295 level. Therefore, the overall corrective phase remains incomplete, supporting further downside movement in the longer term.

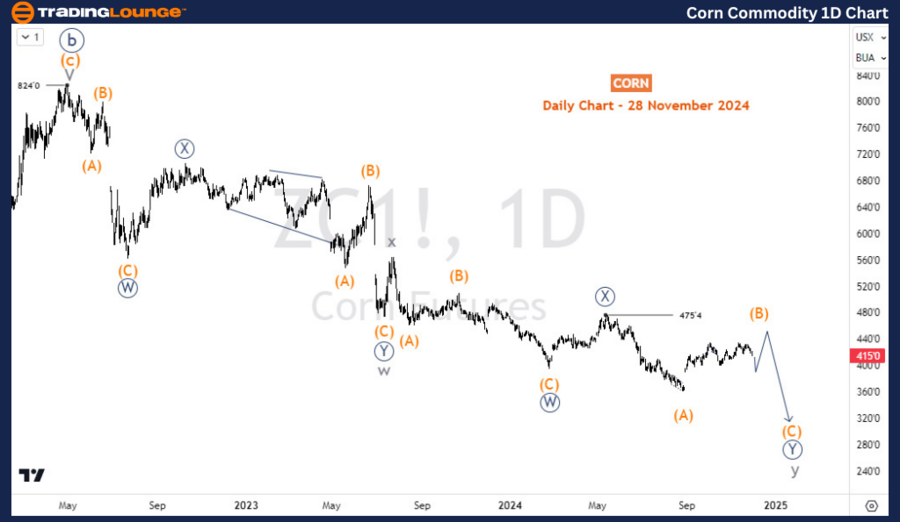
Corn Daily Chart Analysis

On the daily chart, the focus shifts to the third leg of the bearish corrective cycle. Beginning at $824, this third leg has been unfolding into a double zigzag structure:

  • Wave W and Wave X have been completed in the cycle degree.

  • Currently, Corn is navigating Wave Y, which is still incomplete. The market is within Wave (B) of ((Y)) of Y.

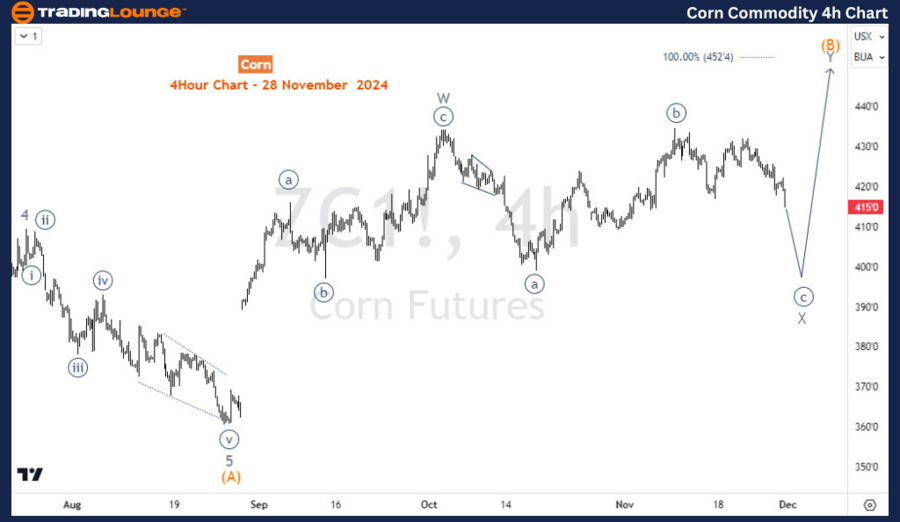
The H4 chart highlights that Wave (B) may be forming a double zigzag structure, with the price currently within the second wave of this sequence.

Corn-Commodity-1D-Ch...


Corn H4 Chart Analysis

In the shorter time frame of Wave (B):

  • The price is developing a flat structure within Wave X.

  • The ongoing dip represents Wave ((c)) of X, which could move below the October 17 low before Wave Y advances, aiming to complete Wave (B).

In the coming weeks, prices are likely to remain volatile and range-bound, with neither bulls nor bears exerting sustained dominance. This choppy market environment may persist as the structure continues to develop.

Technical Analyst: Sanmi Adeagbo

Source: visit Tradinglounge.com and learn From the Experts Join TradingLounge Here 

See Previous: Cocoa Elliott Wave Technical Analysis

VALUE Offer - Buy 1 Month & Get 3 Months!Click here

Access 7 Analysts Over 200 Markets Covered. Chat Room With Support

Corn-Commodity-4h-Ch...

Related

Vanguard Australian shares Index V300AEQ ETF UNITS – VAS Stock Analysis & Elliott Wave Technical Forecast

Vanguard Australian shares Index V300AEQ ETF UNITS – VAS Stock Analysis & Elliott Wave Technical Forecast

This detailed analysis covers the ASX ETF VAS (V300AEQ), focusing on Elliott Wave trends, technical ...

Read More >
KOSPI Composite is in a Bullish Trend - KOSPI Elliott Wave Technical Analysis on the Daily and Weekly Charts

KOSPI Composite is in a Bullish Trend - KOSPI Elliott Wave Technical Analysis on the Daily and Weekly Charts

The KOSPI Composite is in a bullish trend, confirmed by Elliott Wave analysis on the daily and weekl...

Read More >
Valuable Forex Trading Strategies For U.S. Dollar / Swiss Franc Currency Pair with USDCHF Elliott Wave Technical Analysis

Valuable Forex Trading Strategies For U.S. Dollar / Swiss Franc Currency Pair with USDCHF Elliott Wave Technical Analysis

This article provides a thorough USDCHF analysis based on Elliott Wave theory, covering daily and 4-...

Read More >
NEOUSD Elliott Wave Technical  Analysis: Latest Price Prediction, WXY Correction Pattern, and Market Trend Insights

NEOUSD Elliott Wave Technical Analysis: Latest Price Prediction, WXY Correction Pattern, and Market Trend Insights

NEOUSD is currently experiencing a corrective counter-trend movement, forming a zigzag (WXY) pattern...

Read More >
Unlock Bovespa Index Insights: Elliott Wave Technical Analysis for Smarter Trading

Unlock Bovespa Index Insights: Elliott Wave Technical Analysis for Smarter Trading

The Bovespa Index Elliott Wave analysis provides in-depth insights into market trends, wave structur...

Read More >
S&P 500 Elliott Wave Analysis: Stock Market Forecast, Trading Strategy, Wave Count, Price Prediction & Market Trends Breakdown

S&P 500 Elliott Wave Analysis: Stock Market Forecast, Trading Strategy, Wave Count, Price Prediction & Market Trends Breakdown

S&P 500 Elliott Wave Analysis provides a comprehensive breakdown of market trends, wave structures, ...

Read More >

$1 for 2 Weeks

then $29 a month!

What a Special Offer!

Trade Recommendations

Unleash the power of deversified trading with our comprehensive portfolio, covering 250+ markets:

  • Stock Trades
  • Crypto Trades
  • Forex Trades
  • Commodity Trades
Elliott Wave Analysis

Gain a competitive edge with expert insights and AI-powered Elliott Wave charting into:

  • Global Indices
  • US Stocks & ASX Stocks
  • Forex & Crypto
  • Commodities
Top-Notch Trading Tools

Equip yourself with the tools of success:

  • Real-time Chat rooms
  • Elliott Wave Algorithm
  • Portfolio tools
  • TradingLevels
  • Screener
  • Trading Game
7 Elliott Wave Analysts

Stay ahead of the market with daily charts and insightful videos
Your secret to strategic trading!

JOIN HERE


Welcome to TradingLounge (ASIC A.R.No. 321187), specialists in trades, trading education and technical analysis, covering stocks, indices, commodities, forex and cryptocurrencies.

When you join TradingLounge you have access to everything we offer, including trade tools, educational content and a social platform to chat with like-minded investors.

Read more

@Copyright 2024 by tradinglounge.com

Contact Us

Australian no: 02 4787 6020

International no: +61 (2) 47876020

Pay with:

Find us on