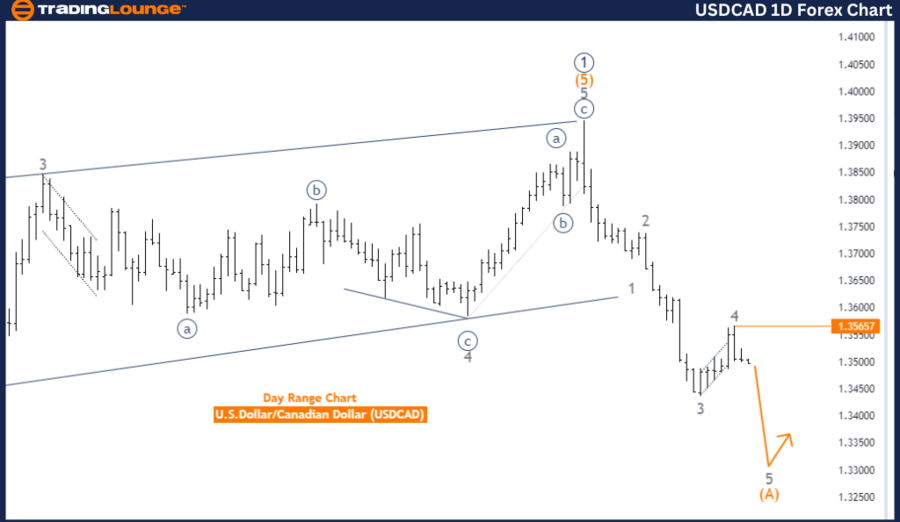
USDCAD Elliott Wave Analysis – Trading Lounge Day Chart

U.S. Dollar / Canadian Dollar (USDCAD) Day Chart

USDCAD Elliott Wave Technical Analysis

Function: Counter Trend

Mode: Impulsive

Structure: Gray wave 5

Position: Orange wave A

Next Higher Degree Direction: Orange wave B

Details: Gray wave 4 has completed, and gray wave 5 is now active.

Wave Cancellation Invalidation Level: 1.35657

The USD/CAD daily chart shows a counter-trend movement, revealed by Elliott Wave technical analysis. This movement is impulsive in nature, indicating a strong directional momentum in the market. The focus is on gray wave 5, which follows the completion of gray wave 4. Gray wave 5 is currently underway.

At this stage, the market is positioned within orange wave A, part of a larger wave sequence. Following the completion of orange wave A, the next expected move is orange wave B, which belongs to a higher wave degree. This implies that after the completion of gray wave 5's impulsive phase, the market could enter a corrective phase, indicated by orange wave B.

The wave cancellation invalidation level is marked at 1.35657. If the price reaches or exceeds this level, the current wave analysis will become invalid, requiring a new evaluation of the market structure. It is crucial for traders to closely monitor this level to ensure the accuracy of the current wave pattern.

Key Takeaways:

  • Gray wave 5 is active after the completion of gray wave 4.
  • The market is currently in orange wave A, with orange wave B anticipated next.
  • The wave cancellation invalidation level is 1.35657, a critical level for maintaining or reassessing the current wave analysis.

USDCAD-1D-Forex-Char...


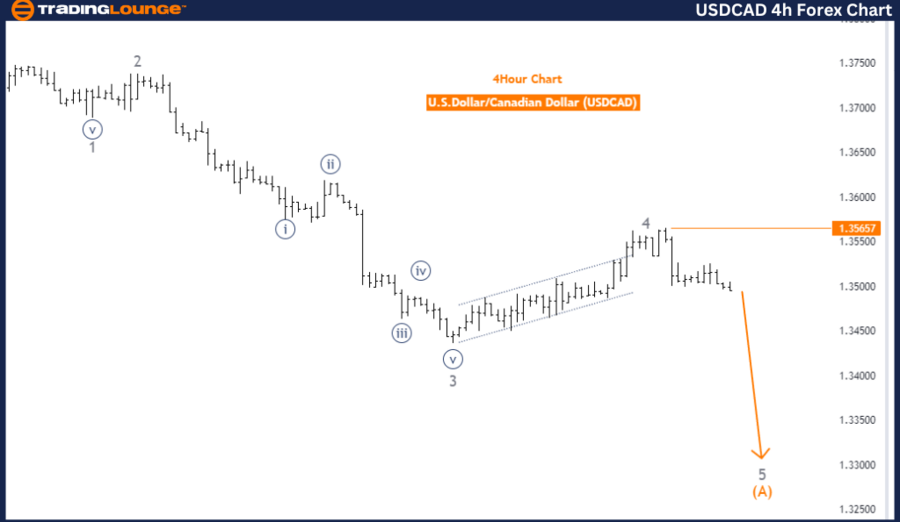
U.S. Dollar / Canadian Dollar (USDCAD) 4-Hour Chart Analysis

USDCAD Elliott Wave Technical Analysis

  • Function: Counter Trend

  • Mode: Impulsive

  • Structure: Gray wave 5

  • Position: Orange wave A

  • Next Higher Degree Direction: Orange wave B

  • Details: Gray wave 4 has completed, and gray wave 5 is currently progressing.

  • Wave Cancellation Invalidation Level: 1.35657

The USD/CAD 4-hour chart also reveals a counter-trend movement through Elliott Wave technical analysis. This movement, classified as impulsive, suggests strong market momentum in a specific direction.

The analysis highlights gray wave 5, which follows gray wave 4's completion. Now, the market is progressing through gray wave 5. The current wave position is within orange wave A, which is part of the broader wave cycle. Once orange wave A is complete, the next expected movement is orange wave B, signaling a shift into a corrective phase.

The analysis sets a wave cancellation invalidation level at 1.35657. Breaching this level would invalidate the current wave analysis, requiring a reassessment of the trend and wave structure.

Key Takeaways:

  • Gray wave 5 is progressing after gray wave 4's completion.
  • The market is currently in orange wave A, with orange wave B anticipated to follow.
  • Traders should monitor the invalidation level at 1.35657 to confirm or adjust the current wave structure.

Technical Analyst: Malik Awais

Source: visit Tradinglounge.com and learn From the Experts Join TradingLounge Here 

Previous: British Pound/U.S. Dollar (GBPUSD) Elliott Wave Technical Analysis

Special Trial Offer - 0.76 Cents a Day for 3 Months! Click here

Access 7 Analysts Over 200 Markets Covered. Chat Room With Support

USDCAD-4h-Forex-Char...

Related

Palo Alto Networks (PANW) Stock Forecast: Elliott Wave Signals Bullish Reversal With Price Targets & Key Support at $150

Palo Alto Networks (PANW) Stock Forecast: Elliott Wave Signals Bullish Reversal With Price Targets & Key Support at $150

PANW stock shows bullish momentum with Elliott Wave analysis indicating a completed correction and a...

Read More >
TRXUSD Elliott Wave Analysis: Trading Strategy & Market Trends for Massive Gains – Is TRX Ready for a Bullish Breakout? Find Out Now!

TRXUSD Elliott Wave Analysis: Trading Strategy & Market Trends for Massive Gains – Is TRX Ready for a Bullish Breakout? Find Out Now!

This TRXUSD Elliott Wave analysis provides insights into the current market structure, key support a...

Read More >
Gold Elliott Wave Analysis: Bullish Trend Towards $3,000 with Possible Pullbacks Creating new Buying Opportunities

Gold Elliott Wave Analysis: Bullish Trend Towards $3,000 with Possible Pullbacks Creating new Buying Opportunities

Gold is in a strong bullish trend, with Elliott Wave analysis indicating further upside potential. T...

Read More >
UNI/USD Elliott Wave Technical Analysis: Price Predictions, Technical Indicators and Profitable Trading Strategies

UNI/USD Elliott Wave Technical Analysis: Price Predictions, Technical Indicators and Profitable Trading Strategies

Elliott Wave analysis of UNI/USD, highlighting key technical indicators, corrective wave structures,...

Read More >
IBEX 35 Technical Analysis Using Elliott Wave Shows Bullish Momentum, Investment Outlook, and Trading Strategy Insights

IBEX 35 Technical Analysis Using Elliott Wave Shows Bullish Momentum, Investment Outlook, and Trading Strategy Insights

Elliott Wave analysis of the IBEX 35 index, highlighting its current bullish trend. Learn about wave...

Read More >
Looking to Invest in Nikkei 225 ETFs, Index Funds, or Individual Stocks: N225 Index Elliott Wave Technical Analysis

Looking to Invest in Nikkei 225 ETFs, Index Funds, or Individual Stocks: N225 Index Elliott Wave Technical Analysis

Stay ahead in the Nikkei 225 market with expert trading insights and analysis. This comprehensive gu...

Read More >

Buy 1 Month

Get 3 Months!

Special Offer:

Trade Recommendations

Unleash the power of deversified trading with our comprehensive portfolio, covering:

  • Stock Trades
  • Crypto Trades
  • Forex Trades
  • Commodity Trades
Elliott Wave Analysis

Gain a competive edge with expert insights in to:

  • Global Indices
  • US Stocks & ASX Stocks
  • Forex & Crypto
  • Commodities
Top-Notch Trading Tools

Equip yourself with the tools of success:

  • Social Chat
  • Elliott Wave Algorithm
  • Screener
  • TradingLevels
  • Trading Game
7 Elliott Wave Analysts

Stay ahead of the market with daily charts and insightful videos
-Your secret to strategic trading!

JOIN HERE


Welcome to TradingLounge (ASIC A.R.No. 321187), specialists in trades, trading education and technical analysis, covering stocks, indices, commodities, forex and cryptocurrencies.

When you join TradingLounge you have access to everything we offer, including trade tools, educational content and a social platform to chat with like-minded investors.

Read more

@Copyright 2024 by tradinglounge.com

Contact Us

Australian no: 02 4787 6020

International no: +61 (2) 47876020

Pay with:

Find us on