GBPUSD Elliott Wave Analysis Trading Lounge Day Chart

British Pound/U.S. Dollar (GBPUSD) Day Chart Analysis

GBPUSD Elliott Wave Technical Analysis

  • Function: Trend

  • Mode: Impulsive

  • Structure: Gray wave 1

  • Position: Orange wave 3

  • Direction Next Lower Degrees: Gray wave 2

  • Details: Orange wave 2 of 3 appears complete; gray wave 1 of 3 is active.

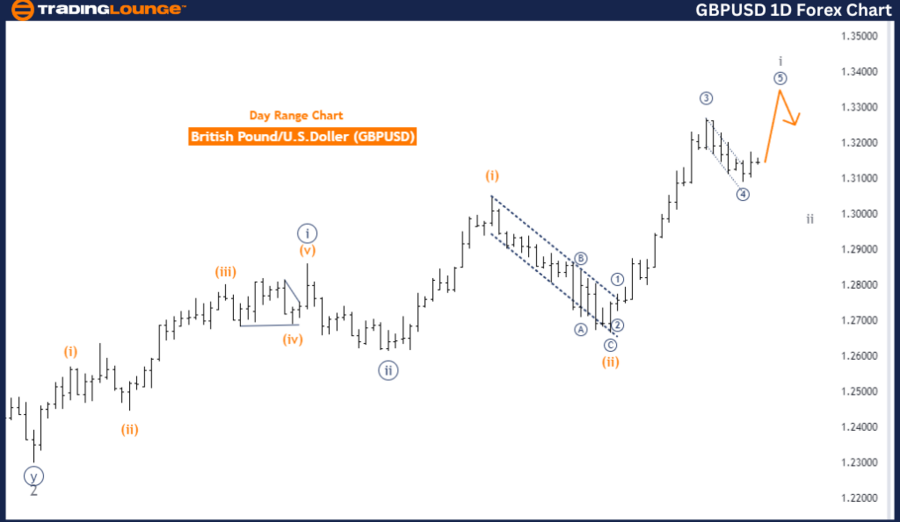
The GBPUSD daily chart analysis shows the British Pound to US Dollar pair trending impulsively. The current market structure suggests a strong directional move, following an impulsive wave pattern. The key wave in focus is gray wave 1, part of a larger wave cycle.

At this point, the market is in orange wave 3, a crucial phase of the ongoing wave pattern. With the completion of orange wave 2 of 3, gray wave 1 of 3 has initiated. This development typically indicates significant price movements, marking the early phase of the current wave.

The analysis indicates that orange wave 2 of 3 has likely concluded, transitioning into gray wave 1 of 3. This suggests continued upward movement in line with the prevailing trend.

Summary

The GBPUSD pair continues its impulsive trend, with gray wave 1 of 3 unfolding. The completion of orange wave 2 of 3 signals the transition to gray wave 1 of 3, pointing to sustained upward momentum. This wave analysis is crucial for traders, highlighting potential opportunities as the market moves into the next wave cycle.

GBPUSD-1D-Forex-Char...


GBPUSD Elliott Wave Analysis Trading Lounge 4-Hour Chart

British Pound/U.S. Dollar (GBPUSD) 4-Hour Chart Analysis

GBPUSD Elliott Wave Technical Analysis

  • Function: Trend

  • Mode: Impulsive

  • Structure: Micro navy blue wave 5

  • Position: Gray wave 1

  • Direction Next Lower Degrees: Gray wave 2

  • Details: Micro navy blue wave 4 of 1 seems complete; micro navy blue wave 5 of 1 is active.

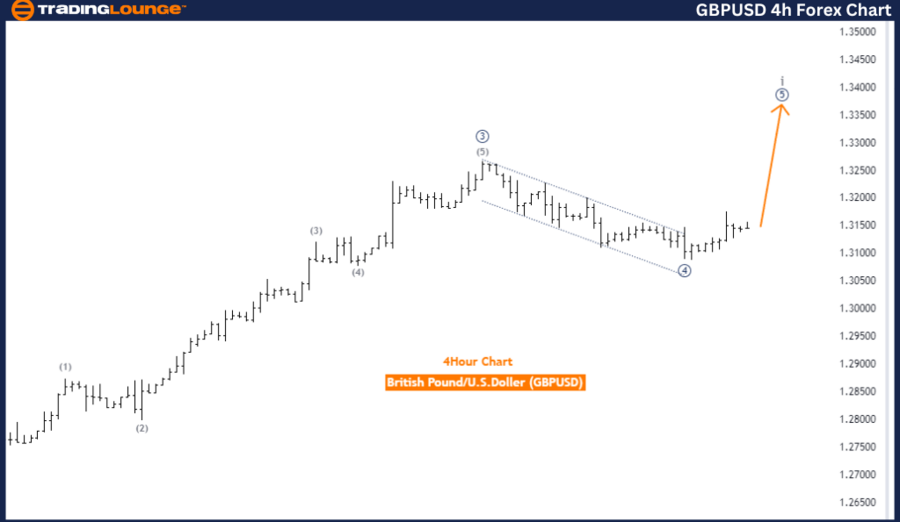
The GBPUSD 4-hour chart analysis reveals the currency pair is in a strong impulsive wave trend. The current market structure highlights micro navy blue wave 5, which forms part of a broader wave movement.

Currently, the pair is positioned in gray wave 1, marking the early stage of a larger wave cycle. Following the conclusion of this phase, gray wave 2 is expected to unfold.

An important observation is that micro navy blue wave 4 of 1 seems to have completed. The market is now advancing through micro navy blue wave 5 of 1, which represents the final movement in this impulse wave sequence, signaling the nearing completion of wave 1.

Summary

The GBPUSD pair remains in an impulsive trend, with micro navy blue wave 5 of 1 currently progressing. The completion of micro navy blue wave 4 points to the final phase of this sequence, with gray wave 2 expected to follow. Traders should monitor wave 5 closely for signs of a potential shift into the next phase of the wave cycle.

Technical Analyst: Malik Awais

Source: visit Tradinglounge.com and learn From the Experts Join TradingLounge Here 

Previous: British Pound/Japanese Yen (GBPJPY) Elliott Wave Technical Analysis

Special Trial Offer - 0.76 Cents a Day for 3 Months! Click here

Access 7 Analysts Over 200 Markets Covered. Chat Room With Support

GBPUSD-4h-Forex-Char...

Related

Learn about Ethereum's Crypto Price uptrend and downtrend indicators: ETHUSD Elliott Wave Technical Analysis

Learn about Ethereum's Crypto Price uptrend and downtrend indicators: ETHUSD Elliott Wave Technical Analysis

This analysis provides a detailed overview of Ethereum price prediction using Elliott Wave Theory. I...

Read More >
Corn Commodity Elliott Wave Technical Analysis: Delves into the current price movements, forecasts, and trading strategies

Corn Commodity Elliott Wave Technical Analysis: Delves into the current price movements, forecasts, and trading strategies

This article provides a detailed Elliott Wave analysis of the corn market as of 2024. It delves into...

Read More >
Gain Insights into Stock Market Trends and Analysis: RUSSELL 2000 Indices Elliott Wave Technical Analysis

Gain Insights into Stock Market Trends and Analysis: RUSSELL 2000 Indices Elliott Wave Technical Analysis

Dive into our comprehensive guide on Elliott Wave Analysis and the Russell 2000 Index. Understand th...

Read More >
Elliott Wave Analysis Indices: SP 500 & NASDAQ

Elliott Wave Analysis Indices: SP 500 & NASDAQ

Elliott Wave Analysis Summary: Indices SP 500 & NASDAQ - Current wave: v of (v) of iii) of 1 o...

Read More >
British Pound/Japanese Yen(GBPJPY) Elliott Wave Technical Analysis 23 October 23

British Pound/Japanese Yen(GBPJPY) Elliott Wave Technical Analysis 23 October 23

The British Pound/Japanese Yen(GBPJPY) Elliott Wave Analysis for the day and 4-hour chart on 23 Octo...

Read More >

Buy 1 Month

Get 3 Months!

Special Offer:

Trade Recommendations

Unleash the power of deversified trading with our comprehensive portfolio, covering:

  • Stock Trades
  • Crypto Trades
  • Forex Trades
  • Commodity Trades
Elliott Wave Analysis

Gain a competive edge with expert insights in to:

  • Global Indices
  • US Stocks & ASX Stocks
  • Forex & Crypto
  • Commodities
Top-Notch Trading Tools

Equip yourself with the tools of success:

  • Social Chat
  • Elliott Wave Algorithm
  • Screener
  • TradingLevels
  • Trading Game
7 Elliott Wave Analysts

Stay ahead of the market with daily charts and insightful videos
-Your secret to strategic trading!

JOIN HERE


Welcome to TradingLounge (ASIC A.R.No. 321187), specialists in trades, trading education and technical analysis, covering stocks, indices, commodities, forex and cryptocurrencies.

When you join TradingLounge you have access to everything we offer, including trade tools, educational content and a social platform to chat with like-minded investors.

Read more

@Copyright 2024 by tradinglounge.com

Contact Us

Australian no: 02 4787 6020

International no: +61 (2) 47876020

Pay with:

Find us on