15Apr

AMCOR PLC – AMC Elliott Wave Forecast Reveals Bullish Wave 3 Setup with Price Targets, Stock Analysis, and Trading Strategy

AMCOR PLC – AMC Elliott Wave Technical Analysis 

Introduction:

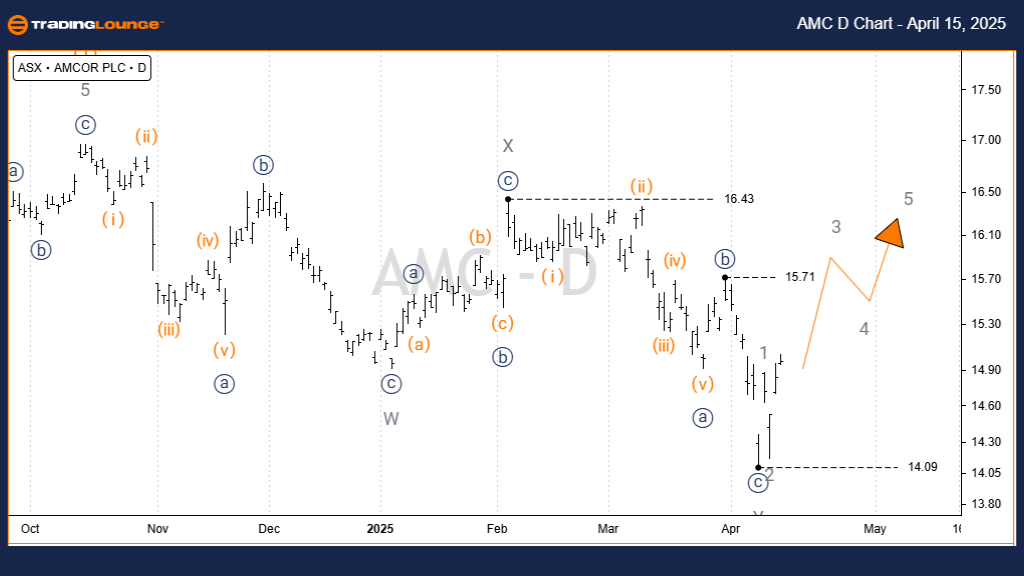
Welcome to today’s Elliott Wave forecast for AMCOR PLC (ASX: AMC). AMC has recently concluded its second corrective phase, unfolding as a Double Zigzag pattern. This structure sets the stage for a third motive wave, typically the most powerful in Elliott Wave terms, hinting at a bullish trend. This technical review highlights the potential upside and outlines the detailed Elliott Wave count behind this scenario.


AMCOR PLC – AMC Elliott Wave Technical Analysis TradingLounge (1D Chart – Semilog Scale)

Function: Major Trend (Intermediate Degree – Orange)

Mode: Motive

Structure: Impulse

Position: Wave (3) – Orange

Details:

  • Wave (1) – Orange: Successfully completed.
  • Wave (2) – Orange: Recently finalized as a Double Zigzag (W, X, Y – Grey).
  • Now entering Wave (3) – Orange, with upward price action gaining traction.

Invalidation Point: 14.11

AMCOR-PLC-d-asx-char...


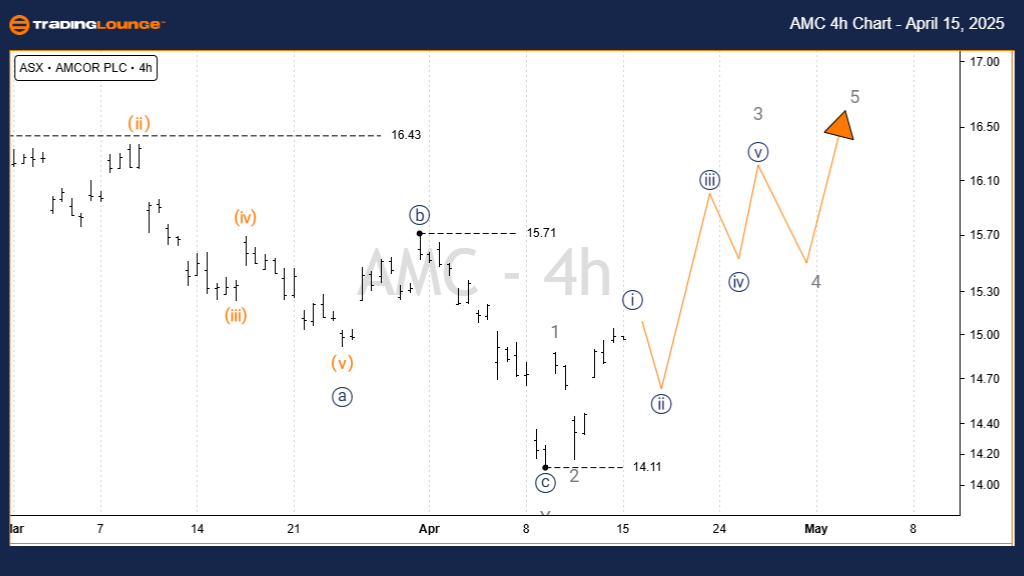
AMCOR PLC – AMC Elliott Wave Technical Analysis TradingLounge  (4-Hour Chart)

Function: Major Trend (Minor Degree – Grey)

Mode: Motive

Structure: Impulse

Position: Wave i)) – Navy of Wave 3 – Grey of Wave (3) – Orange

Details:

  • Wave Y – Grey of Wave (2) – Orange concluded as a Zigzag, signaling the end of the correction.
  • From the 14.11 level, waves 1, 2, and 3 – Grey are developing.
  • Currently, Wave 3 – Grey is in progress, subdividing into five waves (i)) to v)) – Navy.
  • Price action suggests continuation of the upward impulse.

Invalidation Point: 14.11

Technical Analyst: Hua (Shane) Cuong, CEWA-M (Master’s Designation).

Source: Visit Tradinglounge.com and learn from the Experts. Join TradingLounge Here 

See Previous: CAR GROUP LIMITED – CAR Elliott Wave Technical Analysis

VALUE Offer - Buy 1 Month & Get 3 Months!Click here

Access 7 Analysts Over 200 Markets Covered. Chat Room With Support

AMCOR-PLC-4h-asx-cha...


Conclusion:

This Elliott Wave analysis for AMCOR PLC – AMC offers a data-driven view on the ongoing bullish wave cycle. With the correction completed and impulse waves forming, traders can monitor key levels for confirmation. By leveraging wave counts and invalidation points, this forecast supports informed trading strategies aligned with the broader market trend. Stay tuned for further updates as AMC develops within this emerging structure.

Related

Elliott Wave Trading Outlook: S&P 500, NASDAQ 100, DAX 40, FTSE 100 & ASX 200 Strategies

Elliott Wave Trading Outlook: S&P 500, NASDAQ 100, DAX 40, FTSE 100 & ASX 200 Strategies

Global indices are maintaining bullish Elliott Wave patterns, with clearer counts emerging in Europe...

Read More >
Meta Platforms Inc.(META:NYSE) Elliott Wave Technical Analysis 19 January 24

Meta Platforms Inc.(META:NYSE) Elliott Wave Technical Analysis 19 January 24

Meta Platforms Inc.(META: NASDAQ) Elliott Wave Technical Analysis dated 19 January 24. Meta Stock An...

Read More >
Uniswap Crypto Forecast: Elliott Wave Signals Bullish Reversal – UNIUSD Trading Strategy, Price Targets & Key Breakout Levels

Uniswap Crypto Forecast: Elliott Wave Signals Bullish Reversal – UNIUSD Trading Strategy, Price Targets & Key Breakout Levels

Uniswap (UNIUSD) shows signs of a completed Elliott Wave correction, hinting at a bullish reversal n...

Read More >
Adani Green Energy - ADANIGREEN Stock Forecast Using Elliott Wave Analysis on Daily and Weekly Charts

Adani Green Energy - ADANIGREEN Stock Forecast Using Elliott Wave Analysis on Daily and Weekly Charts

Elliott Wave analysis of Adani Green stock, highlighting trend direction, forecast patterns, and tra...

Read More >
Natural Gas Commodity Forecast: NG Elliott Wave Technical Analysis Predicts Bullish Rally | Rebounding Strongly Since April

Natural Gas Commodity Forecast: NG Elliott Wave Technical Analysis Predicts Bullish Rally | Rebounding Strongly Since April

Natural Gas has been rebounding strongly since April. Elliott Wave analysis shows a potential bullis...

Read More >
S&P 500 ELLIOTT WAVE ANALYSIS, 20 JAN 2022

S&P 500 ELLIOTT WAVE ANALYSIS, 20 JAN 2022

S&P500 Expect support at 4500, but eventually expect the market to move through this Minor Level and...

Read More >

$1 for 2 Weeks

then $29 a month!

What a Special Offer!

Trade Recommendations

Unleash the power of deversified trading with our comprehensive portfolio, covering 250+ markets:

  • Stock Trades
  • Crypto Trades
  • Forex Trades
  • Commodity Trades
Elliott Wave Analysis

Gain a competitive edge with expert insights and AI-powered Elliott Wave charting into:

  • Global Indices
  • US Stocks & ASX Stocks
  • Forex & Crypto
  • Commodities
Top-Notch Trading Tools

Equip yourself with the tools of success:

  • Real-time Chat rooms
  • Elliott Wave Algorithm
  • Portfolio tools
  • TradingLevels
  • Screener
  • Trading Game
7 Elliott Wave Analysts

Stay ahead of the market with daily charts and insightful videos
Your secret to strategic trading!

JOIN HERE


Welcome to TradingLounge (ASIC A.R.No. 321187), specialists in trades, trading education and technical analysis, covering stocks, indices, commodities, forex and cryptocurrencies.

When you join TradingLounge you have access to everything we offer, including trade tools, educational content and a social platform to chat with like-minded investors.

Read more

@Copyright 2024 by tradinglounge.com

Contact Us

Australian no: 02 4787 6020

International no: +61 (2) 47876020

Pay with:

Find us on