29Oct

Unlocking ASX Trading Success: JAMES HARDIE INDUSTRIES PLC - JHX Stock Analysis & Elliott Wave Technical Forecast

ASX: JAMES HARDIE INDUSTRIES PLC - JHX Elliott Wave Technical Analysis TradingLounge (1D Chart)

Greetings! Our updated Elliott Wave analysis on JAMES HARDIE INDUSTRIES PLC (JHX) for the Australian Stock Exchange (ASX) suggests a continued potential for downward movement. We anticipate the ((3))-navy wave may resume with momentum to the upside in the future.

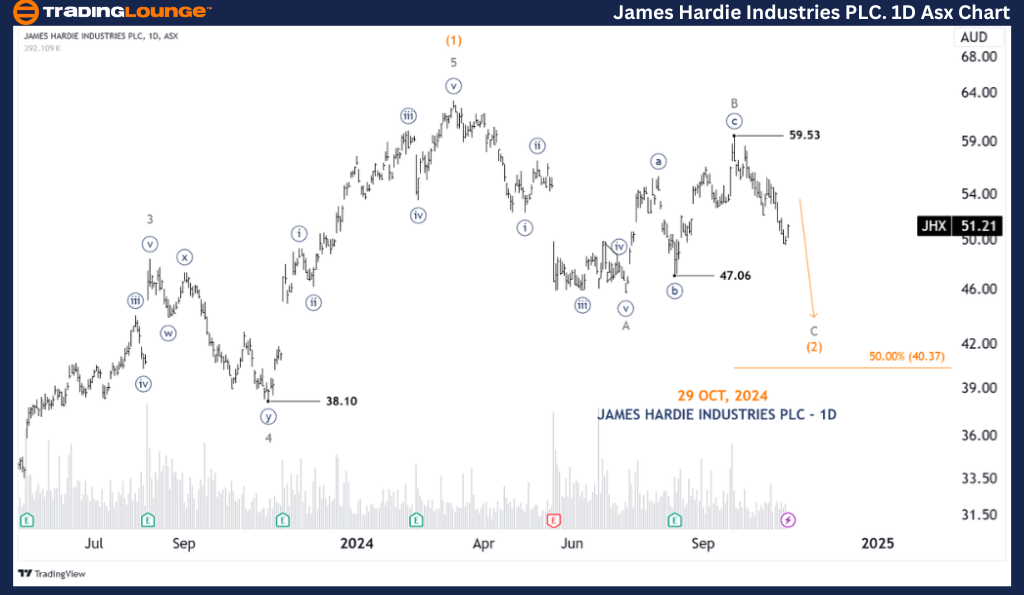
ASX: JAMES HARDIE INDUSTRIES PLC - JHX 1D Chart (Semilog Scale) Analysis

JHX Elliott Wave Technical Analysis

Function: Major trend (Intermediate degree, Orange)

Mode: Motive

Structure: Impulse

Position: Wave c-grey of Wave (2)-orange

Details: With the completion of the B-grey wave, the unfolding C-grey wave indicates a push downward. We target a potential move down to around 40.37.

Invalidation Point: 59.53

JAMES-HARDIE-INDUSTR...


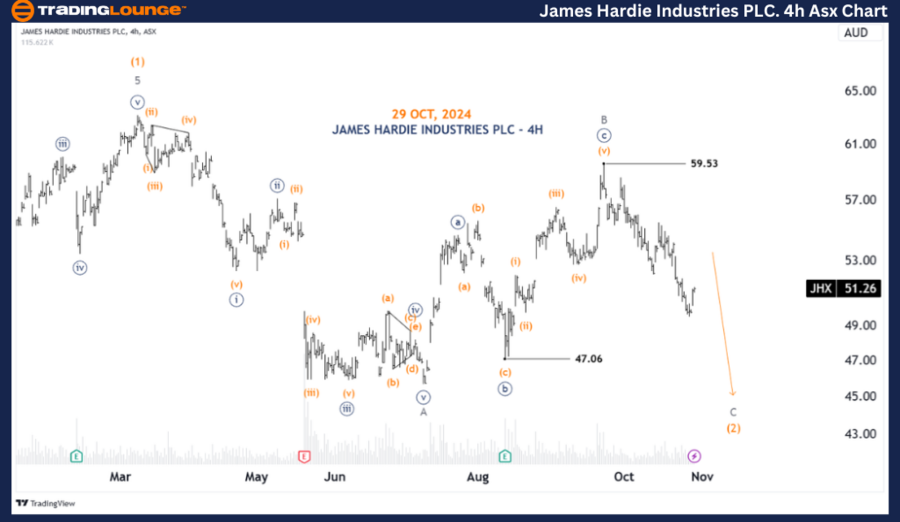
ASX: JAMES HARDIE INDUSTRIES PLC - JHX 4-Hour Chart Analysis

Function: Major trend (Intermediate degree, Orange)

Mode: Motive

Structure: Impulse

Position: Wave C-grey of Wave (2)-orange

Details: Since reaching the high near 59.53, the C-grey wave continues to show potential for further downward movement, targeting levels like 47.06 or below. To maintain this wave count, price must remain below 59.53. A movement above this level would suggest that the (3)-orange wave could regain momentum to the upside.

Invalidation Point: 59.53

Technical Analyst: Hua (Shane) Cuong, CEWA-M (Master’s Designation).

Source: visit Tradinglounge.com and learn From the Experts Join TradingLounge Here 

See Previous: RIO TINTO LIMITED – RIO Elliott Wave Technical Analysis

VALUE Offer - Buy 1 Month & Get 3 Months!Click here

Access 7 Analysts Over 200 Markets Covered. Chat Room With Support

JAMES-HARDIE-INDUSTR...

Conclusion

This Elliott Wave analysis of ASX: JAMES HARDIE INDUSTRIES PLC - JHX provides a technical perspective on current market trends and potential investment opportunities. We highlight key validation and invalidation levels to help build confidence in our wave count. By integrating these insights, we aim to provide readers with a clear and professional approach to identifying market trends and navigating potential price movements effectively.

Related

Gold XAUUSD Commodity Elliott Wave Analysis: Explore the Current Price Trends, Wave Structures, and Future Projections

Gold XAUUSD Commodity Elliott Wave Analysis: Explore the Current Price Trends, Wave Structures, and Future Projections

In this comprehensive Gold Elliott Wave Analysis, we explore the current price trends, wave structur...

Read More >
MicroStrategy Inc. (MSTR) Elliott Wave Analysis: Stock Price Prediction, Key Support and Resistance Levels, and Market Trends

MicroStrategy Inc. (MSTR) Elliott Wave Analysis: Stock Price Prediction, Key Support and Resistance Levels, and Market Trends

Elliott Wave analysis of MicroStrategy (MSTR) predicts a decline toward $213, with key support at $2...

Read More >
Cocoa Elliott Wave Technical Analysis: Key Price Trends, Bullish Trends, Wave Structures, and Market Insights for Record Highs in 2025

Cocoa Elliott Wave Technical Analysis: Key Price Trends, Bullish Trends, Wave Structures, and Market Insights for Record Highs in 2025

Elliott Wave analysis of Cocoa prices, highlighting key technical trends, wave structures, and price...

Read More >
Unlocking ASX Trading Success: Santos Limited (STO) Stock Analysis & Elliott Wave Technical Forecast

Unlocking ASX Trading Success: Santos Limited (STO) Stock Analysis & Elliott Wave Technical Forecast

Dive into the ASX market with Santos Limited (STO) stock analysis and Elliott Wave forecast. Stay ah...

Read More >
S&P/TSX 60 Elliott Wave Chart Reveals Bullish Impulse With Strong Wave 3 Setup and Key Support Holding at 1339

S&P/TSX 60 Elliott Wave Chart Reveals Bullish Impulse With Strong Wave 3 Setup and Key Support Holding at 1339

The S&P/TSX 60 Elliott Wave count shows a bullish structure with wave 3 developing. Canadian stocks ...

Read More >

$1 for 2 Weeks

then $29 a month!

What a Special Offer!

Trade Recommendations

Unleash the power of deversified trading with our comprehensive portfolio, covering 250+ markets:

  • Stock Trades
  • Crypto Trades
  • Forex Trades
  • Commodity Trades
Elliott Wave Analysis

Gain a competitive edge with expert insights and AI-powered Elliott Wave charting into:

  • Global Indices
  • US Stocks & ASX Stocks
  • Forex & Crypto
  • Commodities
Top-Notch Trading Tools

Equip yourself with the tools of success:

  • Real-time Chat rooms
  • Elliott Wave Algorithm
  • Portfolio tools
  • TradingLevels
  • Screener
  • Trading Game
7 Elliott Wave Analysts

Stay ahead of the market with daily charts and insightful videos
Your secret to strategic trading!

JOIN HERE


Welcome to TradingLounge (ASIC A.R.No. 321187), specialists in trades, trading education and technical analysis, covering stocks, indices, commodities, forex and cryptocurrencies.

When you join TradingLounge you have access to everything we offer, including trade tools, educational content and a social platform to chat with like-minded investors.

Read more

@Copyright 2024 by tradinglounge.com

Contact Us

Australian no: 02 4787 6020

International no: +61 (2) 47876020

Pay with:

Find us on