Introduction to Elliott Wave Technical Analysis in Wheat Trading
Wheat Elliott Wave Analysis
Function - Trend
Mode - Trend
Structure - Diagonal (D1)
Position - Blue wave ‘x’
Direction - Downwards for blue wave ‘y’ of Y of (5)
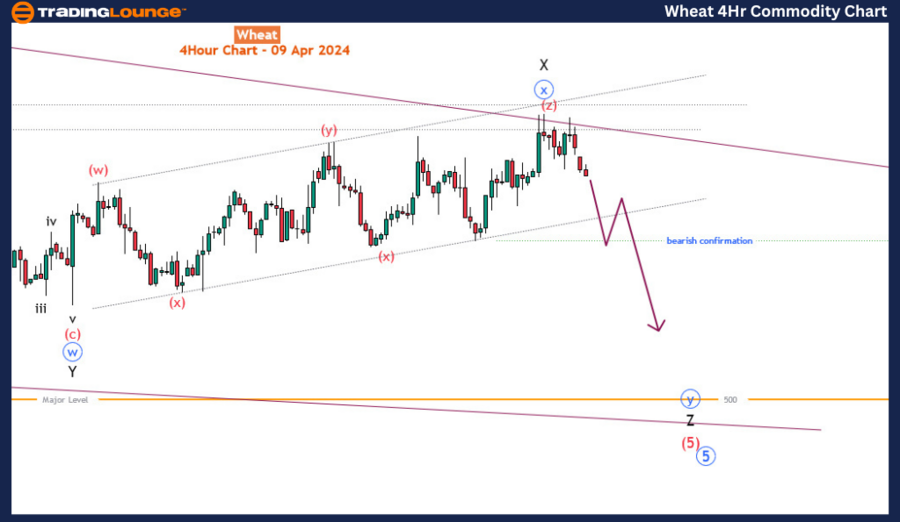
Details - Rallies were rejected again at the 559-572 Fib resistance zone as blue wave ‘x’ completed a triple three pattern. The structure still favours the downside for blue wave ‘y’ of Y of (5) especially if 540 is broken downside.
Wheat has recently concluded a triple-three pattern that commenced on March 11, 2023. With this pattern's completion, the commodity now appears poised to extend lower, continuing the long-term bearish trend that was initiated in March 2022. Notably, this long-term bearish trend is nearing the final stage of an impulse wave pattern. As the impulse pattern draws to a close, a significant rebound is anticipated, expected to be the most substantial since the trend's inception over two years ago. In today's commodity blog post, we will delve into the current state of the bearish trend preceding this impending recovery and explore strategies for short-term traders to navigate what may constitute the final leg of the trend.
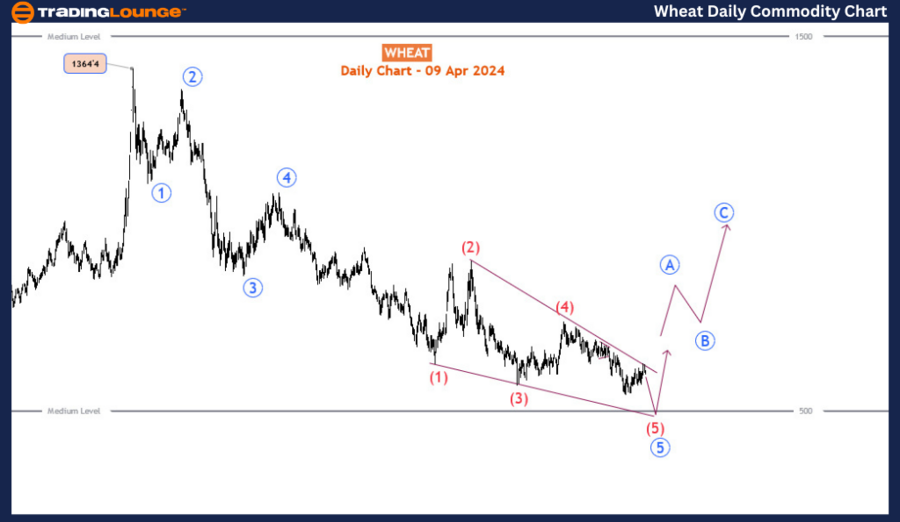
Wheat Day Chart Analysis
Analyzing the daily timeframe, we observe a bearish impulse wave pattern originating from 1364. This impulse wave culminates with an ending diagonal pattern, which has exhibited the lengthiest duration among the waves within the impulse. The sub-waves of the diagonal 5th are delineated in red as wave (1) to (5). Commencing in December 2023 at 649, wave (5) is evolving into a triple three structure, as evidenced by the H4 chart. Within this triple three pattern - denoted as wave W-X-Y - the recent bounce from March 11, 2024, has concluded with another triple three pattern, wave X. We now anticipate the final leg, wave Y, to extend lower, completing the ending diagonal - denoted as wave (5) of blue wave 5 - within the long-term bearish impulse wave. Consequently, at least one more downward leg is expected before the price undergoes a substantial correction, rectifying the over two-year bearish trend.
TradingLounge Wheat Elliott Wave Analysis
Wheat 4-Hour Chart Analysis
Zooming in on the H4 chart, we scrutinize the sub-waves and candlestick patterns comprising wave X. Notably, wave X concluded a triple three pattern and subsequently elicited bearish candlestick formations from a technical supply zone. Confirmation of the termination of wave Z is contingent upon the downside break of the channel, particularly below 540. Subsequently, a further sell-off to approximately 500 or thereabouts is highly probable, culminating in the completion of wave Z of (5) of blue wave 5. Following this, a bullish correction can be anticipated as the market adjusts after the protracted bearish trend. Traders are advised to closely monitor these key levels and adjust their strategies accordingly to navigate the evolving market dynamics effectively.
Technical Analyst: Sanmi Adeagbo
Source: visit Tradinglounge.com and learn From the Experts Join TradingLounge Here
See Previous: Natural Gas
TradingLounge Once Off SPECIAL DEAL: Here > 1 month Get 3 months.
TradingLounge's Free Week Extravaganza!
April 14 – 21: Unlock the Doors to Trading Excellence — Absolutely FREE