Natural Gas Elliott Wave Technical Analysis

Natural Gas broke higher this week, surpassing the previous high set on June 11. The commodity has surged over 120% since its February 2024 low and has now recovered nearly half of the steep sell-off that occurred between August 2022 and February 2024.

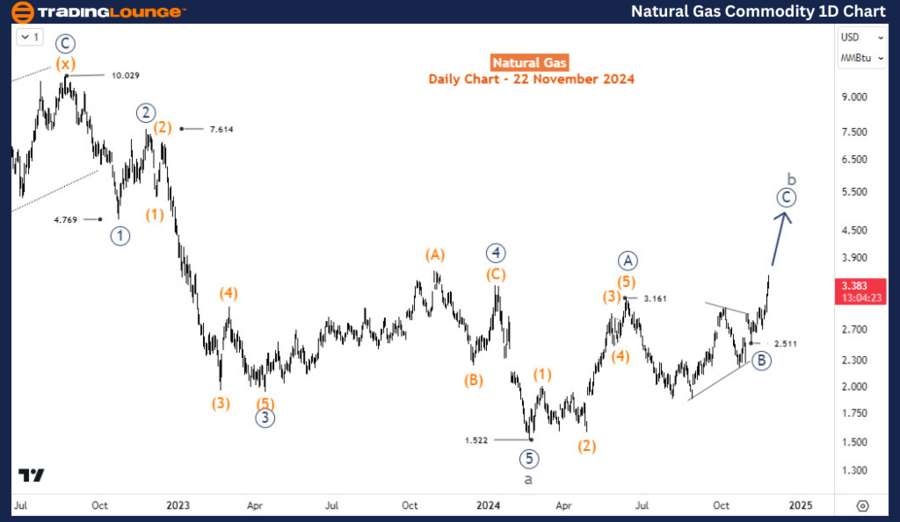
Natural Gas Daily Chart Analysis

On the daily chart, the recovery from the February 21 low of 1.522 is acting as a correction to the entire 5-wave decline seen from August 22, when prices were at $10, to February 21, when prices dropped to nearly $1.5. Using Fibonacci projections, this recovery may extend into the $3.9–$5 range.

  • The first corrective leg, wave ((A)), ended with a 5-wave impulsive structure at 3.16 on June 11.

  • Wave ((B)) followed as a sideways triangle correction.
  • The ongoing rally in wave ((C)), which began at 2.51, is expected to extend higher. Short-term buyers may find opportunities during pullbacks, while swing sellers can wait for the corrective cycle to conclude before taking action.

Natural-Gas-Commodit...


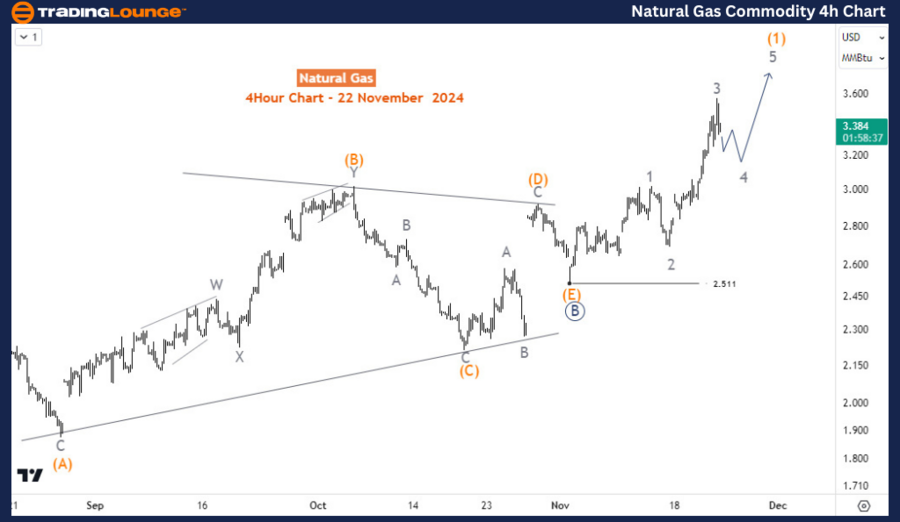
Natural Gas H4 Chart Analysis

On the H4 chart, wave (1) of ((C)) is unfolding and appears to remain incomplete.

  • The price seems to have finished wave 3 of (1) and is currently in a wave 4 pullback.

  • Fresh buying opportunities may arise during the corrective pullback in wave (2), which could serve as an ideal entry point for upward moves.

Investors should monitor these levels closely as the Elliott Wave pattern continues to evolve, offering potential trading setups based on corrections and rallies.

Technical Analyst: Sanmi Adeagbo

Source: visit Tradinglounge.com and learn From the Experts Join TradingLounge Here 

See Previous: Wheat Elliott Wave Technical Analysis

VALUE Offer - Buy 1 Month & Get 3 Months!Click here

Access 7 Analysts Over 200 Markets Covered. Chat Room With Support

Natural-Gas-Commodit...

Related

Comprehensive Elliott Wave Analysis for PayPal (PYPL): Unlocking Stock Trends and Market Opportunities

Comprehensive Elliott Wave Analysis for PayPal (PYPL): Unlocking Stock Trends and Market Opportunities

This article provides an in-depth Elliott Wave analysis of PayPal Holdings Inc. (PYPL), covering bot...

Read More >
Advanced Micro Devices Inc. (AMD) Elliott Wave Analysis: Daily & 1-Hour Chart Insights, Fibonacci Levels, and Stock Forecast

Advanced Micro Devices Inc. (AMD) Elliott Wave Analysis: Daily & 1-Hour Chart Insights, Fibonacci Levels, and Stock Forecast

AMD's Elliott Wave patterns, covering daily and 1-hour chart movements. Key insights include the...

Read More >
NASDAQ 100 STOCKS, AAPL, AMZN, NVDA, META, NFLX, GOOGL, MSFT, TSLA. Elliott Wave Technical Analysis

NASDAQ 100 STOCKS, AAPL, AMZN, NVDA, META, NFLX, GOOGL, MSFT, TSLA. Elliott Wave Technical Analysis

This update on Elliott Wave Analysis highlights the current upward trend in indices and most stocks,...

Read More >
Dogecoin Elliott Wave Analysis: DOGE Price Prediction, Wave Count, Support & Resistance Levels for Crypto Investors

Dogecoin Elliott Wave Analysis: DOGE Price Prediction, Wave Count, Support & Resistance Levels for Crypto Investors

Dogecoin Elliott Wave analysis, helping traders understand the DOGEUSD market structure. Learn about...

Read More >
Discover the latest VanEck Semiconductor ETF (SMH) Stocks Elliott Wave Technical Analysis

Discover the latest VanEck Semiconductor ETF (SMH) Stocks Elliott Wave Technical Analysis

Discover the latest Elliott Wave analysis of the VanEck Semiconductor ETF (SMH) as of May 2024. This...

Read More >
Meta Platforms Inc. Stocks Elliott Wave Technical Analysis - Charts show an ongoing Bullish Trend Highlighting key Resistance Levels

Meta Platforms Inc. Stocks Elliott Wave Technical Analysis - Charts show an ongoing Bullish Trend Highlighting key Resistance Levels

This analysis of Meta Platforms (META) provides a detailed Elliott Wave forecast, highlighting key r...

Read More >

Buy 1 Month

Get 3 Months!

Special Offer:

Trade Recommendations

Unleash the power of deversified trading with our comprehensive portfolio, covering:

  • Stock Trades
  • Crypto Trades
  • Forex Trades
  • Commodity Trades
Elliott Wave Analysis

Gain a competive edge with expert insights in to:

  • Global Indices
  • US Stocks & ASX Stocks
  • Forex & Crypto
  • Commodities
Top-Notch Trading Tools

Equip yourself with the tools of success:

  • Social Chat
  • Elliott Wave Algorithm
  • Screener
  • TradingLevels
  • Trading Game
7 Elliott Wave Analysts

Stay ahead of the market with daily charts and insightful videos
-Your secret to strategic trading!

JOIN HERE


Welcome to TradingLounge (ASIC A.R.No. 321187), specialists in trades, trading education and technical analysis, covering stocks, indices, commodities, forex and cryptocurrencies.

When you join TradingLounge you have access to everything we offer, including trade tools, educational content and a social platform to chat with like-minded investors.

Read more

@Copyright 2024 by tradinglounge.com

Contact Us

Australian no: 02 4787 6020

International no: +61 (2) 47876020

Pay with:

Find us on