PayPal Holdings Inc. (PYPL) Elliott Wave Analysis - Daily and 1-Hour Charts

This comprehensive Elliott Wave analysis for PayPal Holdings Inc. (PYPL) explores both daily and 1-hour charts, providing crucial insights into the potential price direction and structural trends of PYPL. This report is designed to offer traders valuable information on potential market opportunities.

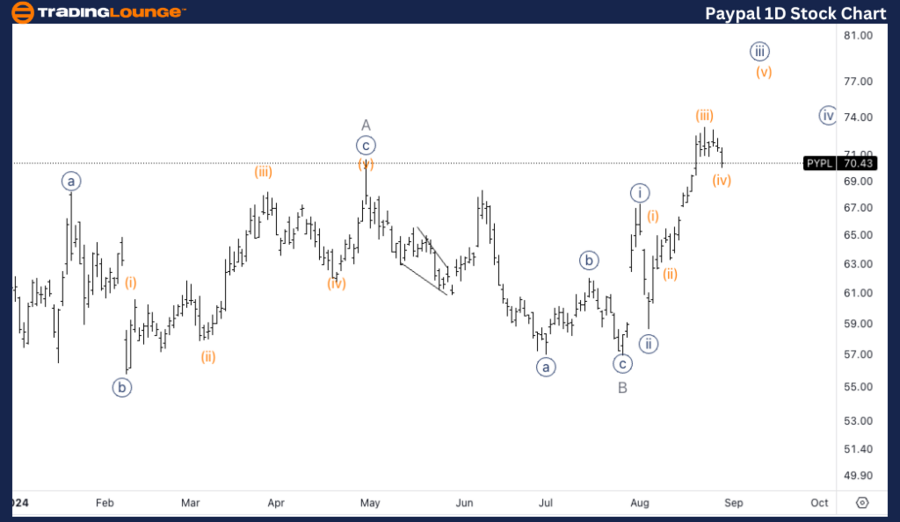
PYPL Elliott Wave Analysis - Daily Chart

PayPal (PYPL) Daily Chart Overview

Technical Elliott Wave Analysis

Function: Trend

Mode: Impulsive

Structure: Motive

Position: Wave 3 or C

Direction: Upside in wave 3/C

Analysis Details:
The current analysis suggests a potential upward trajectory within wave 3 or C, which is expected to manifest in a five-wave structure. At present, it appears that the price action is within wave {iii} of this sequence.

Daily Chart Technical Analysis

PayPal (PYPL) is advancing within wave 3 or wave C, which, if the movement remains impulsive, should unfold as a five-wave pattern. Current price action indicates that PYPL is progressing within wave {iii}, suggesting further upward potential as the wave structure continues to evolve. Confirmation of this wave count will depend on whether the movement remains impulsive, characterized by clear subdivisions into five distinct waves.

Paypal-1D-Stock-Char...


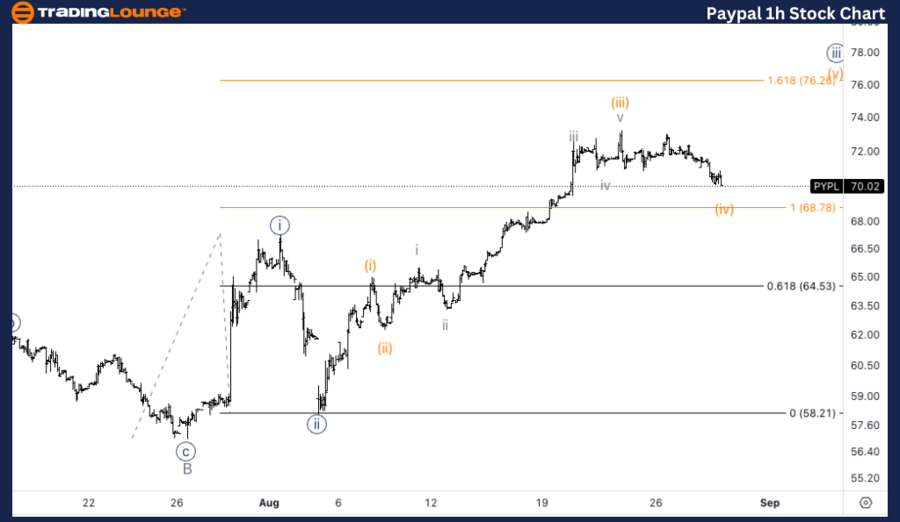
PYPL Elliott Wave Analysis - 1-Hour Chart

PayPal (PYPL) 1H Chart Overview

Technical Elliott Wave Analysis

Function: Trend

Mode: Impulsive

Structure: Motive

Position: Wave {iii} of 3/C

Direction: Upside in wave {iii}

Analysis Details:
A correction is anticipated within wave (iv) of {iii}, as the price has yet to reach the 1.618 extension of wave {iii} relative to wave {i}.

1-Hour Chart Technical Analysis

On the 1-hour chart, PayPal (PYPL) continues to move within wave {iii} of 3 or C, displaying strong upward momentum. However, a correction is expected in wave (iv) of {iii} before further gains are realized. The target for wave {iii} is likely to align with 1.618 times the length of wave {i}, a common extension in Elliott Wave theory. Following the anticipated wave (iv) correction, another upward move is expected to complete wave {iii}.

Technical Analyst: Alessio Barretta

Source: visit Tradinglounge.com and learn From the Experts Join TradingLounge Here 

See Previous: CRM Elliott Wave Technical Analysis  

Special Trial Offer - 0.76 Cents a Day for 3 Months! Click here

Access 7 Analysts Over 200 Markets Covered. Chat Room With Support

Paypal-1h-Stock-Char...

Related

KOTAK BANK Elliott Wave Technical Analysis: Bullish Trend Breakdown, Share Price Forecast, and Strategic Trading Setup

KOTAK BANK Elliott Wave Technical Analysis: Bullish Trend Breakdown, Share Price Forecast, and Strategic Trading Setup

Elliott Wave analysis of KOTAK BANK on both daily and weekly charts. It outlines the bullish structu...

Read More >
Microsoft Inc. (MSFT) Elliott Wave Analysis: Stock Forecast, Price Prediction & Market Trends for Bullish or Bearish Reversal

Microsoft Inc. (MSFT) Elliott Wave Analysis: Stock Forecast, Price Prediction & Market Trends for Bullish or Bearish Reversal

MSFT Elliott Wave analysis examines Microsoft stock's trend using Elliott Wave Theory to identif...

Read More >
S&P BSE Sensex (India) Elliott Wave Analysis: Bullish Trend Forecast, Impulse Wave Patterns, Stock Market Outlook & Trading Strategy

S&P BSE Sensex (India) Elliott Wave Analysis: Bullish Trend Forecast, Impulse Wave Patterns, Stock Market Outlook & Trading Strategy

Elliott Wave forecast for the S&P BSE Sensex, covering both daily and weekly charts. It confirms a b...

Read More >
Bitcoin Elliott WaveTechnical Analysis:Bitcoin Price Prediction and Uptrend Trading Insights

Bitcoin Elliott WaveTechnical Analysis:Bitcoin Price Prediction and Uptrend Trading Insights

Explore detailed Bitcoin Elliott Wave analysis and BTCUSD price predictions. Learn about Wave V, bul...

Read More >
CAR GROUP LIMITED – CAR Elliott Wave Analysis Indicates Potential Bullish Wave (5) with Key Support at 31.73

CAR GROUP LIMITED – CAR Elliott Wave Analysis Indicates Potential Bullish Wave (5) with Key Support at 31.73

Elliott Wave analysis indicates that CAR GROUP LIMITED (ASX: CAR) has likely completed a corrective ...

Read More >
ADANI PORTS & SEZ - ADANIPORT Elliott Wave Forecast Shows Bullish Trend With Key 1040 Support

ADANI PORTS & SEZ - ADANIPORT Elliott Wave Forecast Shows Bullish Trend With Key 1040 Support

Elliott Wave analysis of Adani Ports & SEZ reveals a bullish impulsive trend with upward potential a...

Read More >

$1 for 2 Weeks

then $29 a month!

What a Special Offer!

Trade Recommendations

Unleash the power of deversified trading with our comprehensive portfolio, covering 250+ markets:

  • Stock Trades
  • Crypto Trades
  • Forex Trades
  • Commodity Trades
Elliott Wave Analysis

Gain a competitive edge with expert insights and AI-powered Elliott Wave charting into:

  • Global Indices
  • US Stocks & ASX Stocks
  • Forex & Crypto
  • Commodities
Top-Notch Trading Tools

Equip yourself with the tools of success:

  • Real-time Chat rooms
  • Elliott Wave Algorithm
  • Portfolio tools
  • TradingLevels
  • Screener
  • Trading Game
7 Elliott Wave Analysts

Stay ahead of the market with daily charts and insightful videos
Your secret to strategic trading!

JOIN HERE


Welcome to TradingLounge (ASIC A.R.No. 321187), specialists in trades, trading education and technical analysis, covering stocks, indices, commodities, forex and cryptocurrencies.

When you join TradingLounge you have access to everything we offer, including trade tools, educational content and a social platform to chat with like-minded investors.

Read more

@Copyright 2024 by tradinglounge.com

Contact Us

Australian no: 02 4787 6020

International no: +61 (2) 47876020

Pay with:

Find us on