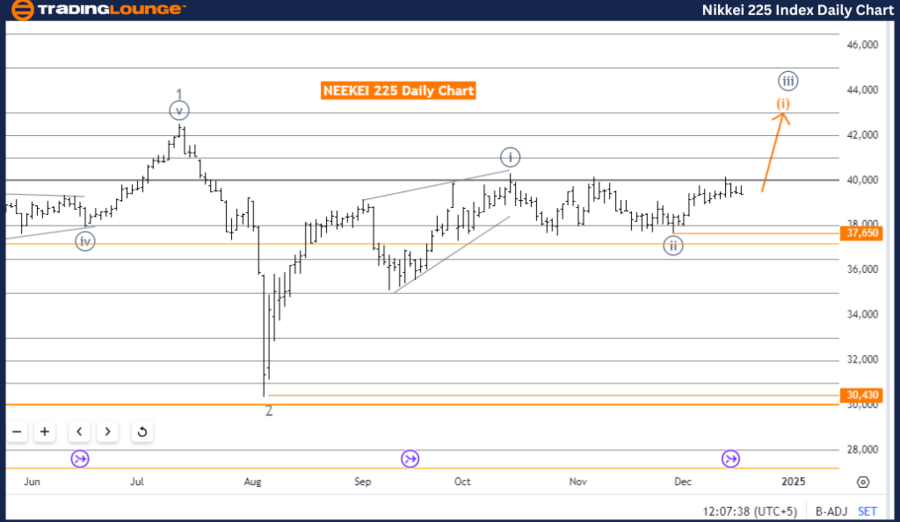
NIKKEI 225 (N225) Elliott Wave Analysis – Trading Lounge Day Chart
NIKKEI 225 (N225) Elliott Wave Technical Analysis
Technical Details
Function: Bullish Trend
Mode: Impulsive
Structure: Orange Wave 1
Position: Navy Blue Wave 3
Direction Next Lower Degrees: Orange Wave 2
Details: Navy blue wave 2 appears complete; orange wave 1 within navy blue wave 3 is now in progress.
Wave Cancel Invalid Level: 37,650
Analysis
The NIKKEI 225 day chart reflects a bullish trend, consistent with Elliott Wave theory. The market remains in an impulsive phase, signaling strong upward momentum. The key focus is orange wave 1, which is actively forming as part of the larger navy blue wave 3. This upward movement indicates the early stages of further gains.
The conclusion of navy blue wave 2 has ended the corrective phase. With this phase complete, the market is now in orange wave 1 within the broader navy blue wave 3, marking the beginning of a fresh upward cycle. This shift aligns with the prevailing bullish sentiment and reflects ongoing strength.
Outlook
The next lower degree points toward orange wave 2, which could bring a temporary correction after orange wave 1 completes. However, as of now, the focus remains on the upward progression of orange wave 1, which is still developing.
Critical Invalidation Level
The wave cancel invalid level stands at 37,650. A move below this level would invalidate the current Elliott Wave structure and necessitate a reassessment of market conditions. Traders must monitor this level for effective risk management and potential trend shifts.
Summary
The NIKKEI 225 day chart shows a clear bullish trend, supported by the conclusion of navy blue wave 2 and the ongoing development of orange wave 1 within navy blue wave 3. The impulsive phase suggests continued upward momentum, with additional price gains likely before any correction begins. Traders are advised to maintain a bullish outlook while closely monitoring the 37,650 invalidation level to manage risk.
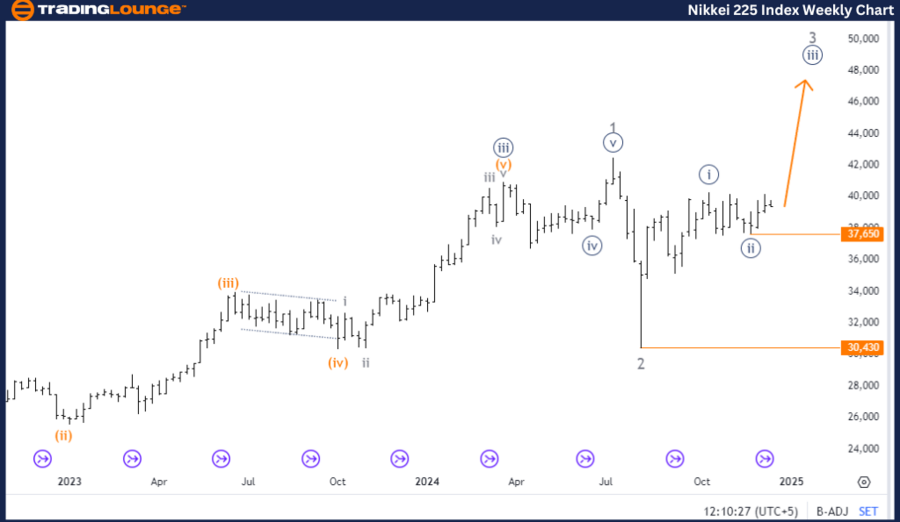
NIKKEI 225 (N225) Elliott Wave Analysis – Trading Lounge Weekly Chart
NIKKEI 225 (N225) Elliott Wave Technical Analysis
Technical Details
Function: Bullish Trend
Mode: Impulsive
Structure: Navy Blue Wave 3
Position: Gray Wave 3
Direction Next Lower Degrees: Navy Blue Wave 4
Details: Navy blue wave 2 appears complete; navy blue wave 3 is currently in progress.
Wave Cancel Invalid Level: 30,430
Analysis
The NIKKEI 225 weekly chart confirms a strong bullish trend in line with Elliott Wave principles. The market remains in an impulsive phase, emphasizing robust upward momentum. The focus is on navy blue wave 3, which is unfolding as part of a broader upward cycle.
Following the completion of navy blue wave 2, the market entered navy blue wave 3, signaling sustained bullish strength. This upward movement highlights that the overall trend remains intact, with further gains anticipated.
Position and Outlook
Currently, the market is positioned within gray wave 3, an intermediate phase that aligns with the broader navy blue wave 3. There are no immediate indications of a reversal, and the next lower degree suggests a transition to navy blue wave 4 once navy blue wave 3 concludes. This phase may introduce a temporary correction before the upward momentum resumes.
Critical Invalidation Level
The wave cancel invalid level is set at 30,430. A decline below this threshold would invalidate the current Elliott Wave count, requiring a reevaluation of the market structure. This level serves as a critical benchmark for risk management and trend confirmation.
Summary
The NIKKEI 225 weekly chart reflects a sustained bullish trend, marked by the completion of navy blue wave 2 and the ongoing development of navy blue wave 3. The impulsive phase confirms continued upward movement, with additional price gains expected before any corrective phase begins. Traders are encouraged to maintain a bullish stance while closely monitoring the 30,430 invalidation level for any changes in market dynamics.
Technical Analyst: Malik Awais
Source: visit Tradinglounge.com and learn From the Experts Join TradingLounge Here
Previous: S&P 500 Elliott Wave Technical Analysis
VALUE Offer - Buy 1 Month & Get 3 Months!Click here
Access 7 Analysts Over 200 Markets Covered. Chat Room With Support