S&P 500 Elliott Wave Analysis - Trading Lounge Day Chart
S&P 500 Elliott Wave Technical Analysis
Function: Trend
Mode: Impulsive
Structure: Orange Wave 3
Position: Navy Blue Wave 3
Direction Next Lower Degrees: Orange Wave 4
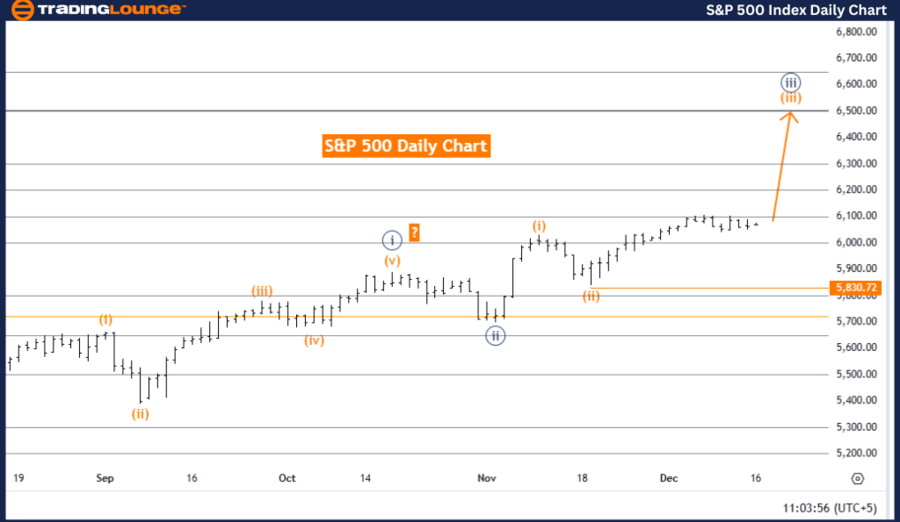
Details: Orange Wave 2 appears completed; currently, Orange Wave 3 of Navy Blue Wave 3 is in progress.
Wave Cancel Invalidation Level: 5,830.72
Analysis Overview
The S&P 500 daily chart showcases a bullish trajectory, as indicated by Elliott Wave analysis. The current wave mode is impulsive, highlighting strong upward momentum driven by a persistent buying trend. The ongoing structure, Orange Wave 3, is progressing within Navy Blue Wave 3, signaling continued bullish action.
The analysis confirms the completion of Orange Wave 2, giving way to the active development of Orange Wave 3. This phase often signifies a period of intense upward movement characterized by elevated market activity and increasing buyer interest. As Orange Wave 3 progresses, it defines the primary bullish direction of the market.
Next Phases and Market Outlook
Following the conclusion of Orange Wave 3, the next anticipated phase will be Orange Wave 4, a corrective movement. For now, the focus remains firmly on the development of Orange Wave 3, which dominates current market behavior with its strong bullish momentum.
Key Levels to Monitor
- The invalidation level for this wave structure is set at 5,830.72.
- Any price movement below this level would invalidate the present wave count and prompt a re-evaluation of the Elliott Wave framework.
- Traders can use this level as a reference point to manage risk effectively and validate the market's bullish trend.
Conclusion
The S&P 500 daily chart underscores a robust bullish trend. The development of Orange Wave 3 within Navy Blue Wave 3 confirms the continuation of upward momentum. With Orange Wave 2 complete, traders should align strategies to capitalize on the prevailing trend while keeping a close watch on the invalidation level at 5,830.72 to manage potential risks and adapt to reversals.

S&P 500 Elliott Wave Analysis - Trading Lounge Weekly Chart
S&P 500 Elliott Wave Technical Analysis
Function: Trend
Mode: Impulsive
Structure: Navy Blue Wave 3
Position: Gray Wave 3
Direction Next Lower Degrees: Navy Blue Wave 4
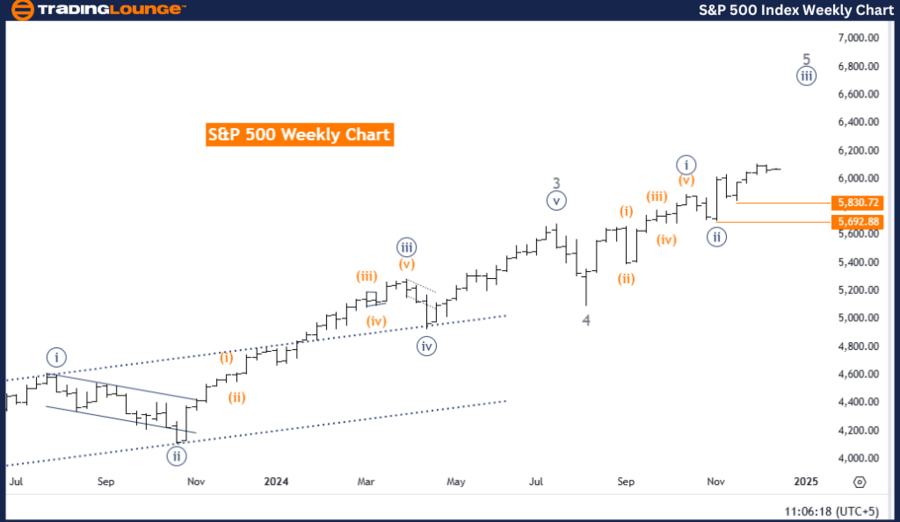
Details: Navy Blue Wave 2 appears completed; Navy Blue Wave 3 of 3 is now in play.
Wave Cancel Invalidation Level: 5,830.72
Analysis Overview
The S&P 500 weekly chart confirms a strong bullish trend through Elliott Wave analysis. The wave mode is impulsive, signifying sustained upward movement and investor confidence. The ongoing wave structure, Navy Blue Wave 3, continues to unfold within the broader trend framework, indicating robust upward momentum.
The analysis suggests that Navy Blue Wave 2 has concluded, paving the way for the active progression of Navy Blue Wave 3 of 3. This phase often represents a powerful bullish surge fueled by heightened market optimism and active participation from buyers. The continued development of Navy Blue Wave 3 reinforces the upward trajectory.
Next Phases and Market Outlook
After the conclusion of Navy Blue Wave 3, the market is expected to transition into a corrective phase marked by Navy Blue Wave 4. However, the current priority remains the development of Navy Blue Wave 3, which drives the prevailing bullish sentiment.
Key Levels to Monitor
- The critical invalidation level for this wave structure is 5,830.72.
- A price drop below this level would invalidate the current Elliott Wave count, requiring a re-evaluation of the market's framework.
- This level serves as an essential benchmark for traders to validate the trend and manage risks effectively.
Conclusion
The S&P 500 weekly chart reflects a strong bullish trend, with Navy Blue Wave 3 driving the market higher. The completion of Navy Blue Wave 2 and the progression of Navy Blue Wave 3 confirm the continued upward trajectory of the market. Traders are advised to align strategies with the bullish momentum while closely monitoring the invalidation level at 5,830.72 to mitigate risks and adapt to potential reversals.
Technical Analyst: Malik Awais
Source: visit Tradinglounge.com and learn From the Experts Join TradingLounge Here
Previous: FTSE 100 (UK) Elliott Wave Technical Analysis
VALUE Offer - Buy 1 Month & Get 3 Months!Click here
Access 7 Analysts Over 200 Markets Covered. Chat Room With Support
