NVIDIA Corp (NVDA) Daily and 4-Hour Elliott Wave Analysis

In this detailed analysis, we delve into NVIDIA Corp's (NVDA) current market position through the lens of Elliott Wave theory on both daily and 4-hour charts. As a leading figure in the tech industry, understanding NVDA's stock movements is crucial for traders and investors alike. This review aims to provide insights into NVDA's trend direction, potential resistance levels, and future price targets, leveraging the Elliott Wave framework for precision and clarity.

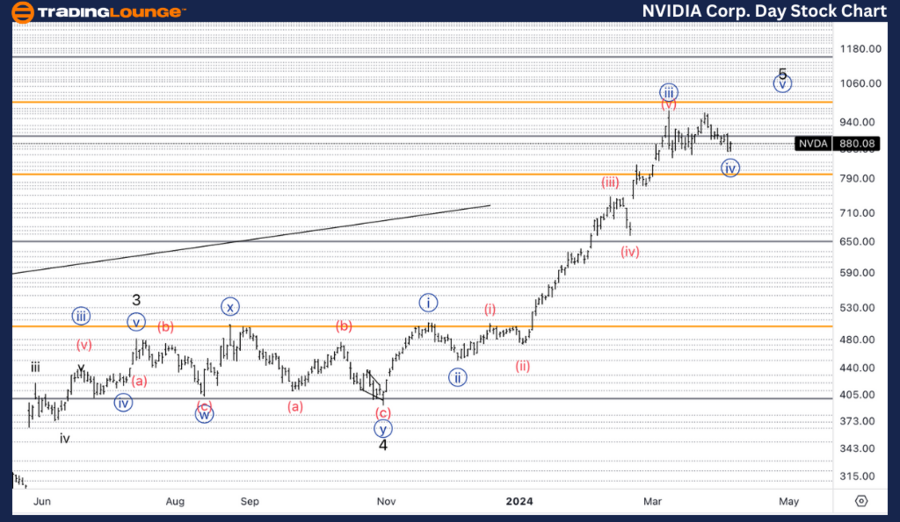
Daily Chart Elliott Wave Analysis of NVIDIA Corp (NVDA)

NVIDIA Corp (NVDA) Elliott Wave Technical Analysis

Function: Trend Identification

Mode: Impulse Waves for Market Direction

Structure: Motive Phase Emphasizing Movement

Position: Targeting Minor Wave 5's Progress

Direction: Anticipating an Upside in Wave {v} of 5

Details: The analysis reveals NVDA's potential bottoming near the $800 resistance level. With this foundation, our sights are set on achieving a bullish target of $1000, marked as TL1, indicating a strong upside momentum as we advance into Minor Wave 5.

Key Takeaways:

  • Resistance Level at $800: NVDA shows strong resistance around this price point, serving as a pivotal moment for the stock's future direction.
  • Upside Target of $1000: The anticipation of reaching the TL1 target highlights a significant growth trajectory for NVDA in the near term.

NVIDIA-Corp-1D-Stock...


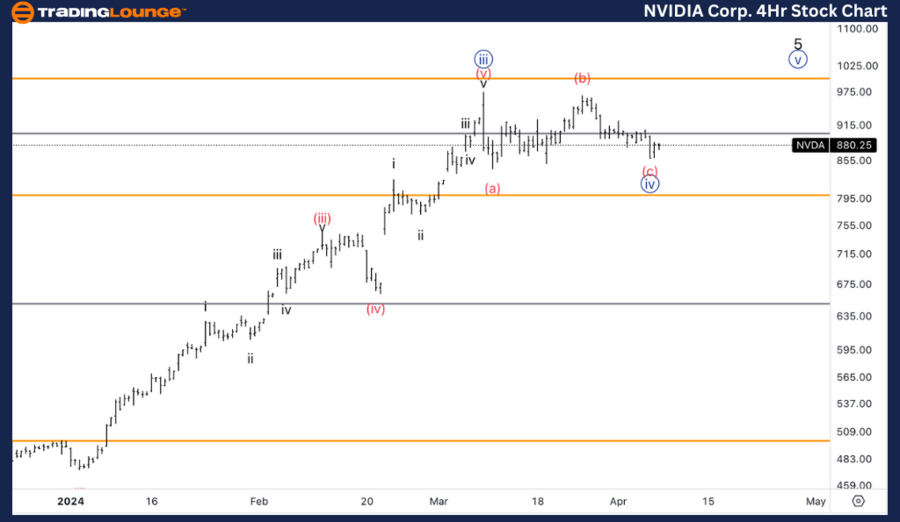
4-Hour Chart Elliott Wave Analysis of NVIDIA Corp (NVDA)

Function: Deciphering Short-Term Trends

Mode: Impulse Actions to Gauge Immediate Movements

Structure: Motive Sequence for Clearer Insight

Position: Examining Wave (c) of {iv} for Current Stance

Direction: Forecasting an Upside into Wave {v}

Details: The 4-hour chart analysis suggests a bullish reversal with the completion of a corrective three-wave pattern in wave {iv}. The focus now shifts towards the commencement of wave {v}, indicating a potential upside momentum in the short term.

Key Takeaways:

  • Completion of Wave {iv}: Indicates a preparatory stage for the next bullish wave, suggesting a strategic entry point for investors.
  • Potential Upside in Wave {v}: Highlights the optimism surrounding NVDA's stock performance, with a clear direction towards growth.

Conclusion

Through meticulous Elliott Wave analysis on both daily and 4-hour charts, NVIDIA Corp (NVDA) exhibits promising signals for both long-term and short-term investors. The stock's resilience at the $800 mark coupled with the ambitious target of $1000 delineates a bullish outlook. Meanwhile, the 4-hour chart underscores the completion of a corrective phase, setting the stage for an imminent upward trajectory. As NVDA continues to navigate through these critical waves, investors and traders are advised to monitor these key levels and trends closely.

Technical Analyst: Alessio Barretta

Source: visit Tradinglounge.com and learn From the Experts Join TradingLounge Here 

See Previous: Walmart Inc. (WMT)

TradingLounge Once Off SPECIAL DEAL: Here > 1 month Get 3 months.

TradingLounge's Free Week Extravaganza!

April 14 – 21: Unlock the Doors to Trading Excellence — Absolutely FREE

NVIDIA-Corp-4Hr-Stoc...

Related

Wheat's Commodity market trends and prepare for significant recovery opportunities: Wheat Elliott Wave Technical Analysis

Wheat's Commodity market trends and prepare for significant recovery opportunities: Wheat Elliott Wave Technical Analysis

Our comprehensive Wheat Elliott Wave analysis covers trend forecasts, price predictions, and key sup...

Read More >
Market Dynamics and Future movements on S&P/TSX 60 Index Elliott Wave Technical Analysis

Market Dynamics and Future movements on S&P/TSX 60 Index Elliott Wave Technical Analysis

The S&P/TSX 60 Elliott Wave analysis provides a comprehensive look at the day and weekly charts, foc...

Read More >
The Coca-Cola Company (KO) Elliott Wave Technical Analysis 30 January 24

The Coca-Cola Company (KO) Elliott Wave Technical Analysis 30 January 24

KO Stock Market Analysis Trading Lounge Day and 4Hr Chart for The Coca-Cola Company (KO) Elliott Wav...

Read More >
Investing in Stocks, ETFs, or index funds: S&P 500 Index Elliott Wave Technical Analysis for Bullish and Bearish Markets

Investing in Stocks, ETFs, or index funds: S&P 500 Index Elliott Wave Technical Analysis for Bullish and Bearish Markets

Explore in-depth S&P 500 Elliott Wave analysis with a focus on trading strategies and investment tip...

Read More >
Forex Analysis of Euro/U.S. Dollar EURUSD Using Elliott Wave Theory Provides Insights into the Current Market Trends

Forex Analysis of Euro/U.S. Dollar EURUSD Using Elliott Wave Theory Provides Insights into the Current Market Trends

This detailed analysis of EURUSD using Elliott Wave Theory provides insights into the current market...

Read More >
Texas Instruments Inc.(TXN) Stocks Elliott Wave Technical Analysis: Daily and 4-Hour Elliott Wave Overview

Texas Instruments Inc.(TXN) Stocks Elliott Wave Technical Analysis: Daily and 4-Hour Elliott Wave Overview

This article provides an in-depth Elliott Wave analysis of Texas Instruments Incorporated (TXN), foc...

Read More >

Buy 1 Month

Get 3 Months!

Special Offer:

Trade Recommendations

Unleash the power of deversified trading with our comprehensive portfolio, covering:

  • Stock Trades
  • Crypto Trades
  • Forex Trades
  • Commodity Trades
Elliott Wave Analysis

Gain a competive edge with expert insights in to:

  • Global Indices
  • US Stocks & ASX Stocks
  • Forex & Crypto
  • Commodities
Top-Notch Trading Tools

Equip yourself with the tools of success:

  • Social Chat
  • Elliott Wave Algorithm
  • Screener
  • TradingLevels
  • Trading Game
7 Elliott Wave Analysts

Stay ahead of the market with daily charts and insightful videos
-Your secret to strategic trading!

JOIN HERE


Welcome to TradingLounge (ASIC A.R.No. 321187), specialists in trades, trading education and technical analysis, covering stocks, indices, commodities, forex and cryptocurrencies.

When you join TradingLounge you have access to everything we offer, including trade tools, educational content and a social platform to chat with like-minded investors.

Read more

@Copyright 2024 by tradinglounge.com

Contact Us

Australian no: 02 4787 6020

International no: +61 (2) 47876020

Pay with:

Find us on