New Zealand Dollar / U.S. Dollar Elliott Wave Analysis | TradingLounge Day Chart
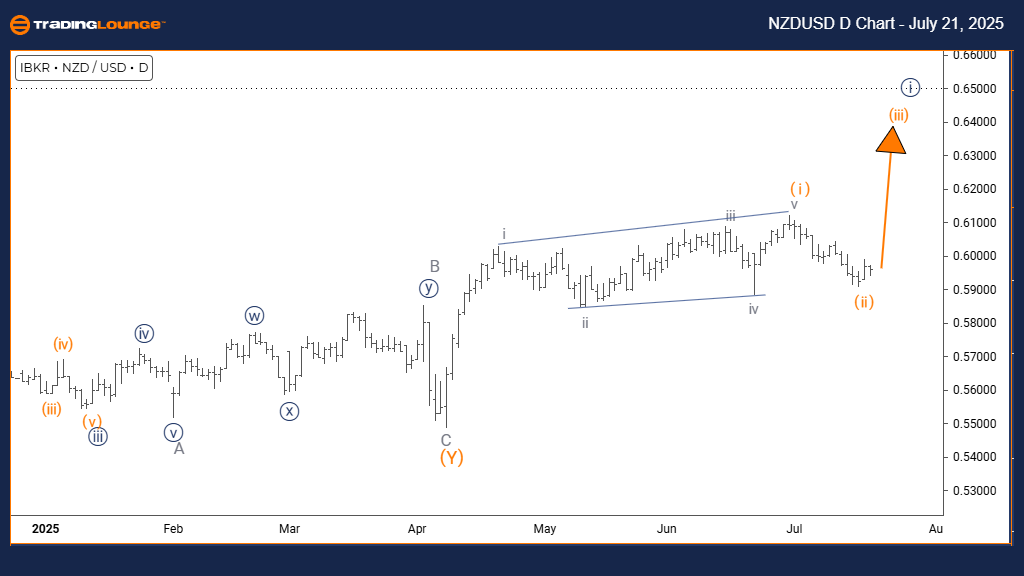
New Zealand Dollar / U.S. Dollar (NZDUSD) Daily Chart Analysis
NZDUSD Elliott Wave Technical Analysis
FUNCTION: Trend
MODE: Impulsive
STRUCTURE: Orange Wave 3
POSITION: Navy Blue Wave 1
DIRECTION OF HIGHER DEGREES: Orange Wave 3 (Initiated)
DETAILS: Orange Wave 2 correction looks complete; Orange Wave 3 is underway.
Wave Cancel Invalid Level: 0.58854
The daily chart of NZDUSD reveals a clear bullish impulse pattern in progress. The currency pair is currently unfolding Orange Wave 3 within the framework of a larger Navy Blue Wave 1, suggesting the start of a potential long-term bullish Elliott Wave cycle. According to Elliott Wave analysis, Orange Wave 2 has likely concluded, and price has shifted into Orange Wave 3 — a segment historically known for its strength and rapid price movement.
The impulsive structure, confirmed by sustained higher highs, signals strong institutional buying activity. With the formation inside Navy Blue Wave 1, this phase could represent the beginning of a wider bullish market trend. The key wave invalidation level is placed at 0.58854; a drop below this point would require a revised Elliott Wave count.
This NZDUSD forecast highlights growing bullish momentum with increasing upside potential. The transition from a corrective to an impulsive wave reinforces market sentiment favoring continued gains. Traders should monitor Orange Wave 3 closely, as this wave often exhibits the most aggressive price action in Elliott Wave structures.
The bullish outlook remains valid as long as the pair holds above the 0.58854 threshold. This technical level serves as a risk control benchmark for trend-following strategies. Market strength across multiple timeframes supports a favorable trading environment, offering setups with high probability and clear risk parameters.
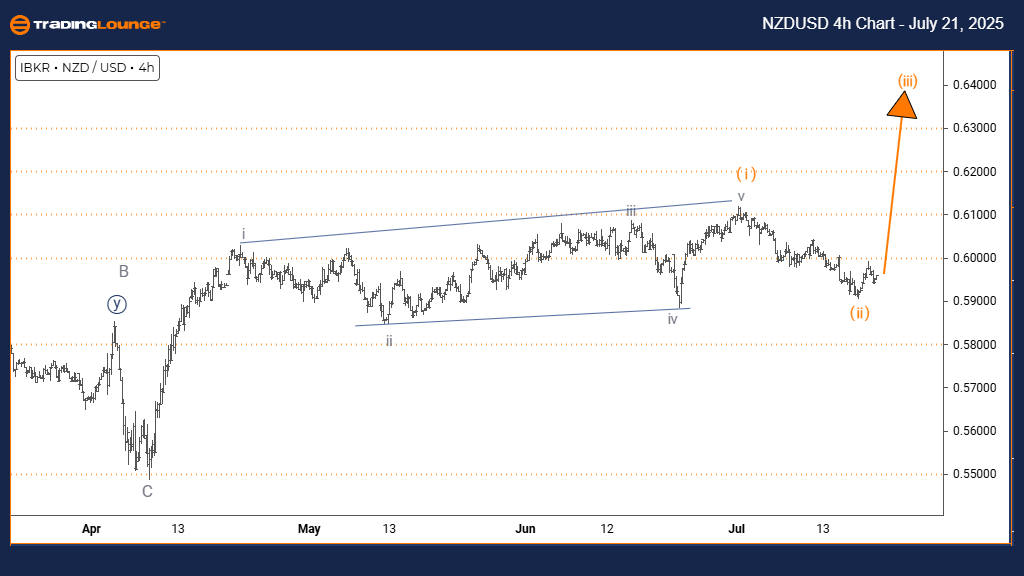
New Zealand Dollar / U.S. Dollar (NZDUSD) 4-Hour Chart
NZDUSD Elliott Wave Technical Analysis
FUNCTION: Trend
MODE: Impulsive
STRUCTURE: Orange Wave 3
POSITION: Navy Blue Wave 1
DIRECTION OF HIGHER DEGREES: Orange Wave 3 (Initiated)
DETAILS: Orange Wave 2 has likely finished. Orange Wave 3 is now developing.
Wave Cancel Invalid Level: 0.58854
The 4-hour chart of NZDUSD confirms a clear trend with impulsive behavior continuing within Orange Wave 3. This move unfolds inside Navy Blue Wave 1, pointing to an early and expanding phase in the broader bullish Elliott Wave cycle. Technical analysis suggests that Orange Wave 2 correction has ended, and the price is now advancing in Orange Wave 3 — typically the most powerful segment in Elliott Wave theory.
This bullish impulse, supported by higher highs, reflects increasing demand from traders and institutions. As Orange Wave 3 progresses, it sets the tone for continued upward movement within the broader trend. The invalidation level remains at 0.58854; any breach of this level would require a reassessment of the current Elliott Wave forecast.
The structure highlights a shift from correction to expansion, signaling strong upside momentum in the short term. The 4-hour timeframe provides timely signals for traders focused on shorter trading cycles. Following Orange Wave 3’s development can offer tactical opportunities to capture trend continuation. The 0.58854 level continues to serve as the key point for validating the bullish scenario.
In summary, the technical outlook for NZDUSD remains positive, with Orange Wave 3 indicating potential for further gains. This phase often produces extended rallies, giving traders high-probability setups with manageable risk. Demand and momentum support the trend, reinforcing expectations for additional bullish movement before encountering resistance.
Technical Analyst: Malik Awais
Source: Visit Tradinglounge.com and learn from the Experts. Join TradingLounge Here
Previous: AUDUSD Elliott Wave Technical Analysis
VALUE Offer - $1 for 2 Weeks then $29 a month!Click here
Access 7 Analysts Over 200 Markets Covered. Chat Room With Support