03Jun

ASX: CAR Group Limited – Comprehensive Elliott Wave Analysis Reveals Bullish Trends and Key Price Targets for Traders

ASX: CAR GROUP LIMITED (CAR) Elliott Wave Analysis - TradingLounge 1D Chart

ASX: CAR GROUP LIMITED – CAR 1D Chart (Semilog Scale) Analysis

ASX: CAR GROUP LIMITED – CAR Elliott Wave Technical Analysis

Function: Major trend (Intermediate degree, orange)

Mode: Motive

Structure: Impulse

Position: Wave iii)) - navy of Wave (5) - orange

Details:

Wave (4) - orange likely concluded at the 28.40 low, after starting from the 42.71 peak. This move appears as a Zigzag structure, labeled A-B-C in grey. The final wave C - grey subdivided into five clear waves, supporting the completion view. This setup strongly indicates that wave (5) - orange is now unfolding. Current market behavior reflects a slight downturn in wave iv)) - navy, with potential for wave v)) - navy to resume the upward trend.

Invalidation point: 34.150 (Price must remain above this level to uphold the current wave outlook.)

CAR-Asx-Day-Chart-03...


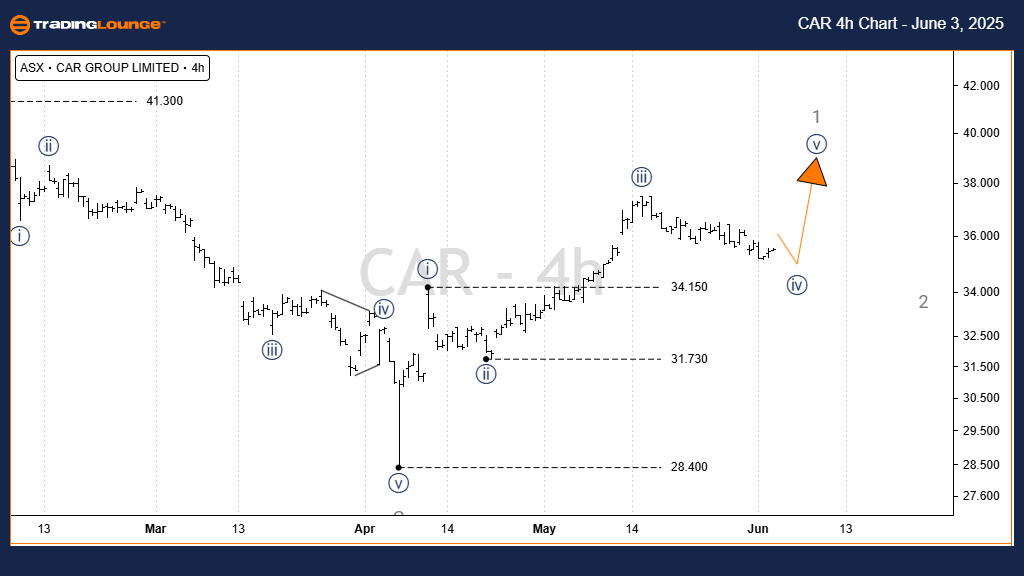
ASX: CAR GROUP LIMITED Elliott Wave Technical Analysis 4-Hour Chart Analysis

Function: Major trend (Minor degree, grey)

Mode: Motive

Structure: Impulse

Position: Wave ((iv)) - navy of Wave 1 - grey

Details:

Wave iv)) - navy is currently correcting lower. However, if it dips below 34.150, the bullish Elliott Wave structure will be invalidated, as wave four should not overlap with wave one in an impulse sequence.

Invalidation point: 34.150 (Maintaining price above this level confirms the bullish outlook.)

Technical Analyst: Hua (Shane) Cuong, CEWA-M (Master’s Designation).

Source: Visit Tradinglounge.com and learn from the Experts. Join TradingLounge Here 

See Previous: Insurance Australia Group Limited (IAG) Elliott Wave Technical Analysis

VALUE Offer - Buy 1 Month & Get 3 Months!Click here

Access 7 Analysts Over 200 Markets Covered. Chat Room With Support
CAR-Asx-4h-Chart-030...


Conclusion:

This Elliott Wave analysis of ASX: CAR GROUP LIMITED – CAR highlights both intermediate and minor trend perspectives. Our forecasts aim to guide traders with actionable price levels and reinforce confidence in potential bullish momentum. By aligning structure validation with key price thresholds, we deliver an analytical edge for navigating current market opportunities.

Related

Daily & Weekly CAC 40 Elliott Wave Analysis: Corrective Counter‑Trend and Bullish Impulse Gray Wave 3, Watch Invalidation Level

Daily & Weekly CAC 40 Elliott Wave Analysis: Corrective Counter‑Trend and Bullish Impulse Gray Wave 3, Watch Invalidation Level

This detailed CAC 40 Elliott Wave analysis explains the current daily corrective Orange Wave 2 insi...

Read More >
Elliott Wave Forecast: Bullish Trends & Trading Strategies for SP500, NASDAQ, DAX, FTSE & ASX 200

Elliott Wave Forecast: Bullish Trends & Trading Strategies for SP500, NASDAQ, DAX, FTSE & ASX 200

Summary: Elliott Wave Market Analysis & Trading Strategy Markets Covered: S&P 500 (SPX), NASDAQ 100...

Read More >
Fortinet Inc. (FTNT) Elliott Wave Technical Analysis: Stock Forecast, Key Fibonacci Levels, and Technical Insights for Traders

Fortinet Inc. (FTNT) Elliott Wave Technical Analysis: Stock Forecast, Key Fibonacci Levels, and Technical Insights for Traders

Elliott Wave analysis of Fortinet Inc. (FTNT), covering daily and 1-hour charts. It explores the cur...

Read More >
Stay ahead with Today insightful Monero Crypto Price News: XMRUSD Elliott Wave Technical Analysis

Stay ahead with Today insightful Monero Crypto Price News: XMRUSD Elliott Wave Technical Analysis

Explore our comprehensive Monero (XMRUSD) Elliott Wave Analysis for the latest price prediction and ...

Read More >
Understand Soybean Commodity Market with the Corrective Phase and Forecasted Price Targets Using Elliott Wave Technical Analysis

Understand Soybean Commodity Market with the Corrective Phase and Forecasted Price Targets Using Elliott Wave Technical Analysis

Explore an in-depth Elliott Wave analysis of Soybean prices, providing key insights into current mar...

Read More >
Elliott Wave analysis insights for Berkshire Hathaway Inc. (BRK.B) as of February 12, 2024.

Elliott Wave analysis insights for Berkshire Hathaway Inc. (BRK.B) as of February 12, 2024.

Explore the latest Elliott Wave analysis insights for Berkshire Hathaway Inc. (BRK.B) as of February...

Read More >

$1 for 2 Weeks

then $29 a month!

What a Special Offer!

Trade Recommendations

Unleash the power of deversified trading with our comprehensive portfolio, covering 250+ markets:

  • Stock Trades
  • Crypto Trades
  • Forex Trades
  • Commodity Trades
Elliott Wave Analysis

Gain a competitive edge with expert insights and AI-powered Elliott Wave charting into:

  • Global Indices
  • US Stocks & ASX Stocks
  • Forex & Crypto
  • Commodities
Top-Notch Trading Tools

Equip yourself with the tools of success:

  • Real-time Chat rooms
  • Elliott Wave Algorithm
  • Portfolio tools
  • TradingLevels
  • Screener
  • Trading Game
7 Elliott Wave Analysts

Stay ahead of the market with daily charts and insightful videos
Your secret to strategic trading!

JOIN HERE


Welcome to TradingLounge (ASIC A.R.No. 321187), specialists in trades, trading education and technical analysis, covering stocks, indices, commodities, forex and cryptocurrencies.

When you join TradingLounge you have access to everything we offer, including trade tools, educational content and a social platform to chat with like-minded investors.

Read more

@Copyright 2024 by tradinglounge.com

Contact Us

Australian no: 02 4787 6020

International no: +61 (2) 47876020

Pay with:

Find us on