ASX: Insurance Australia Group Limited (IAG) Elliott Wave Analysis - Day Chart
ASX: Insurance Australia Group Limited (IAG) Day Chart Analysis
Insurance Australia Group Limited (IAG) Elliott Wave Analysis
Function: Primary trend (Minor degree, grey)
Mode: Motive
Structure: Impulse
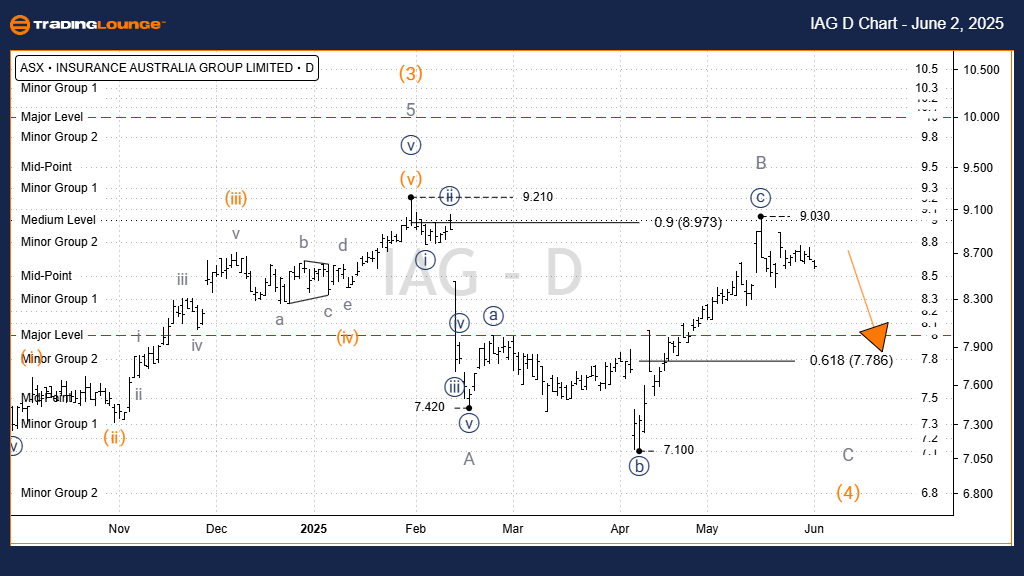
Current Position: Wave C-grey
Technical Summary:
- Wave 3-orange has finalized, confirming a completed five-wave structure.
- Wave 4-orange is correcting lower, taking the form of a Zigzag labeled A, B, C-grey.
- Wave A-grey has fully developed.
- Wave B-grey likely formed an Expanded Flat pattern.
- Wave C-grey is expected to extend downward, with the next support level at 7.79 AUD.
Key Invalidation Level: 9.03 AUD — a price move above this level negates the current wave count.
ASX: Insurance Australia Group Limited (IAG) Elliott Wave Forecast (4-Hour Chart)
Function: Primary trend (Minor degree, grey)
Mode: Motive
Structure: Impulse
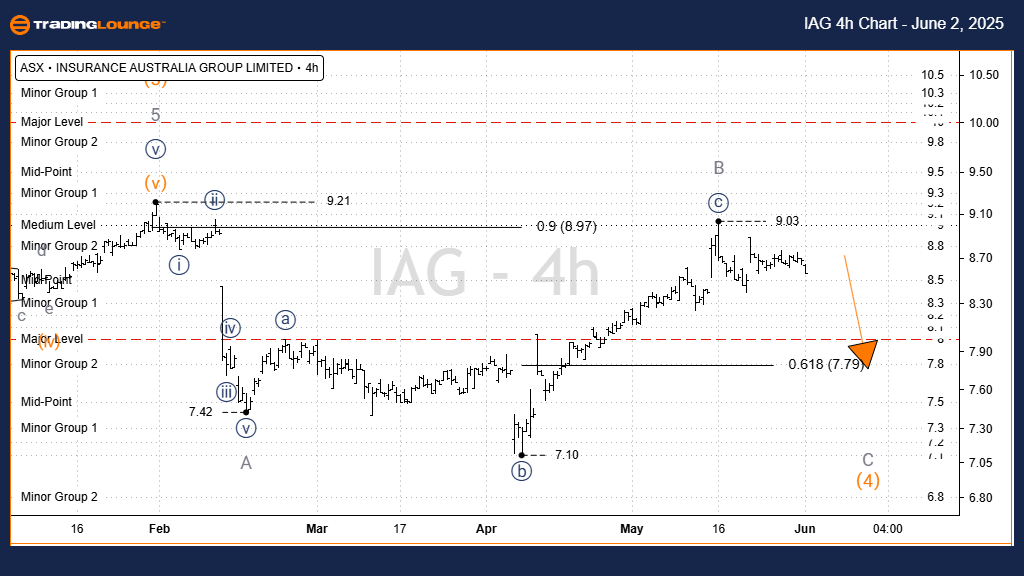
Current Position: Wave C-grey
Technical Summary:
- Waves A-grey and B-grey are now complete.
- After reaching the 9.03 AUD high, price action has initiated a downward trend consistent with Wave C-grey.
- The initial downside target lies at 7.79 AUD, with extended bearish potential toward 7.42–7.10 AUD.
- Sustained price action below 9.03 AUD is necessary to maintain the bearish Elliott Wave scenario.
Technical Analyst: Hua (Shane) Cuong, CEWA-M (Master’s Designation).
Source: Visit Tradinglounge.com and learn from the Experts. Join TradingLounge Here
See Previous: ASX: BLOCK, INC – XYZ Elliott Wave Technical Analysis
VALUE Offer - Buy 1 Month & Get 3 Months!Click here
Access 7 Analysts Over 200 Markets Covered. Chat Room With Support
Conclusion
This Elliott Wave forecast for ASX: Insurance Australia Group Limited (IAG) offers a technical roadmap based on market wave structures. The 1-Day and 4-Hour charts both point to a continued downward trajectory in the near term, contingent upon key resistance levels holding. Traders should monitor 9.03 AUD as the critical invalidation point, with 7.79 AUD and below serving as probable support zones. This structured wave outlook aids in refining short-term strategies and reinforces a disciplined trading approach.