20Aug

NVIDIA Corp. (NVDA) Stocks Elliott Wave Technical Analysis Includes NVDA's Wave Counts, Potential Targets, and Resistance Levels

Welcome to Our Latest Elliott Wave Analysis for NVIDIA Corp. (NVDA)

This analysis delves into NVIDIA Corp.'s (NVDA) price movements utilizing Elliott Wave Theory. Our goal is to help traders identify potential trading opportunities based on the latest trends and market structure. We will explore both the daily and 1-hour charts to provide a comprehensive overview of NVDA's market behavior.

NVDA Elliott Wave Analysis - Trading Lounge Daily Chart

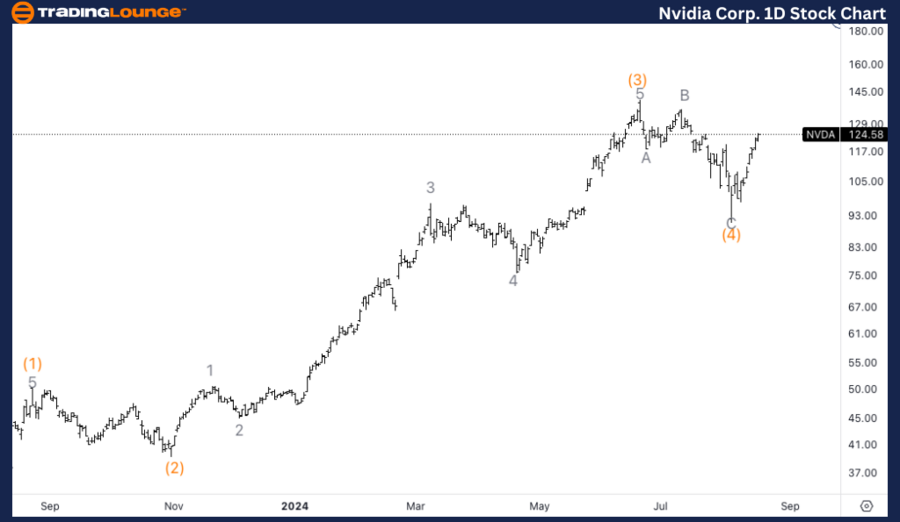
NVIDIA Corp. (NVDA) Daily Chart Analysis

NVDA Elliott Wave Technical Analysis

Function: Trend

Mode: Impulsive

Structure: Motive

Position: Intermediate wave (5)

Direction: Upside in wave (5)

Details: We observe a bottom in wave (4), which ended near the previous wave 4 area—a typical Elliott Wave pattern. With a breakout above the $120 level, we anticipate further upside as wave (5) continues to develop.

NVDA Elliott Wave Technical Analysis – Daily Chart

Recent price actions suggest that wave (4) has likely found its bottom, coinciding with the previous wave 4 area—a common Elliott Wave scenario. The breakout above $120 strengthens the bullish outlook as wave (5) begins to unfold. Traders should closely monitor this uptrend, as wave (5) could drive NVDA to new highs.

NVIDIA-Corp-1D-Stock...


NVDA Elliott Wave Analysis - Trading Lounge 1H Chart

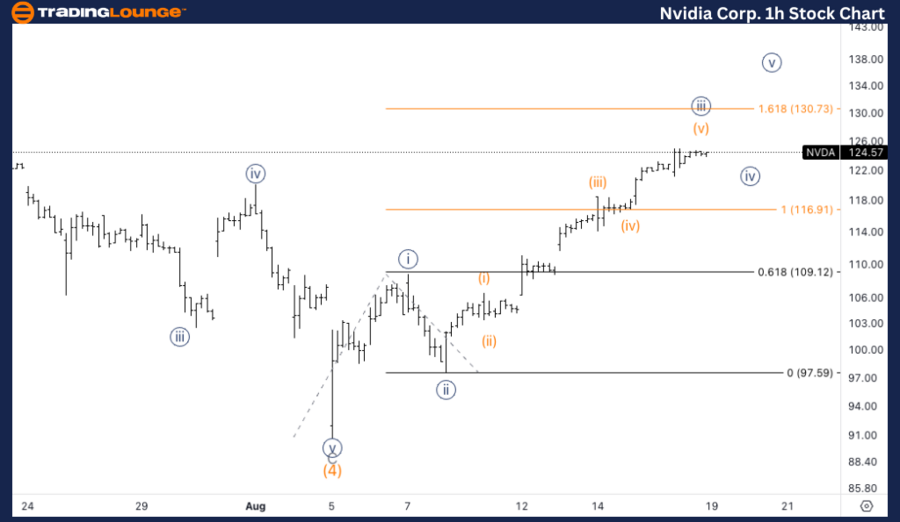
NVIDIA Corp. (NVDA) 1H Chart Analysis

NVDA Elliott Wave Technical Analysis

Function: Trend

Mode: Impulsive

Structure: Motive

Position: Minute {iii}

Direction: Top in wave {iii}

Details: We anticipate an extension in wave {iii}, targeting the $130 level, which aligns with the conclusion of Minor Level 1 (MG1). The $130 level is an important resistance point, where traders should be vigilant for a potential correction in wave {iv}.

NVDA Elliott Wave Technical Analysis – 1H Chart

In the short term, NVDA is extending within wave {iii} of (5). The typical third wave target is around the $130 level, corresponding to the end of Minor Level 1 (MG1). This target may act as a resistance level, where traders should be prepared for a potential correction in wave {iv} after reaching this level.

Technical Analyst: Alessio Barretta

Source: visit Tradinglounge.com and learn From the Experts Join TradingLounge Here 

See Previous: VanEck Semiconductor ETF (SMH) Elliott Wave Technical Analysis

Special Trial Offer - 0.76 Cents a Day for 3 Months! Click here

Access 7 Analysts Over 200 Markets Covered. Chat Room With Support

NVIDIA-Corp-4h-Stock...

Related

Commodity Market Elliott Wave Analysis: Bitcoin, Ethereum, Gold, Silver, Copper, and More

Commodity Market Elliott Wave Analysis: Bitcoin, Ethereum, Gold, Silver, Copper, and More

Commodity Market Elliott Wave Analysis Summary - Dollar (DXY) Should continue to show weakness givi...

Read More >
Coca-Cola Company (KO) Elliott Wave Technical Analysis: KO stock trends with Daily & 4Hr Charts

Coca-Cola Company (KO) Elliott Wave Technical Analysis: KO stock trends with Daily & 4Hr Charts

In the realm of Elliott Wave Analysis, The Coca-Cola Company (KO) is under scrutiny, with a focus on...

Read More >
VETUSD Crypto Pair Analysis Today: VeChain Crypto Price News Elliott Wave Technical Analysis

VETUSD Crypto Pair Analysis Today: VeChain Crypto Price News Elliott Wave Technical Analysis

This article provides a detailed Elliott Wave Analysis of VeChain (VETUSD), including price predicti...

Read More >
The Coca Cola Company (KO:NYSE) Elliott Wave Technical Analysis 20 October 23

The Coca Cola Company (KO:NYSE) Elliott Wave Technical Analysis 20 October 23

The Coca-Cola Company (KO: NYSE) Elliott Wave Technical Analysis For 20 October 23, KO Stock Market ...

Read More >
Cocoa Commodity Elliott Wave Technical Analysis: Market Trends, and Trading Insights for Wave B and Wave C Forecasts

Cocoa Commodity Elliott Wave Technical Analysis: Market Trends, and Trading Insights for Wave B and Wave C Forecasts

Gain valuable insights into cocoa price movements with Elliott Wave analysis. Explore the projected ...

Read More >
Elliott Wave Analysis of Dow Jones (DJI): Insights on Corrective Phase with Orange Wave B and Navy Blue Wave 4 Trends

Elliott Wave Analysis of Dow Jones (DJI): Insights on Corrective Phase with Orange Wave B and Navy Blue Wave 4 Trends

The Dow Jones Industrial Average (DJI) using Elliott Wave Theory highlights the progression of orang...

Read More >

$1 for 2 Weeks

then $29 a month!

What a Special Offer!

Trade Recommendations

Unleash the power of deversified trading with our comprehensive portfolio, covering 250+ markets:

  • Stock Trades
  • Crypto Trades
  • Forex Trades
  • Commodity Trades
Elliott Wave Analysis

Gain a competitive edge with expert insights and AI-powered Elliott Wave charting into:

  • Global Indices
  • US Stocks & ASX Stocks
  • Forex & Crypto
  • Commodities
Top-Notch Trading Tools

Equip yourself with the tools of success:

  • Real-time Chat rooms
  • Elliott Wave Algorithm
  • Portfolio tools
  • TradingLevels
  • Screener
  • Trading Game
7 Elliott Wave Analysts

Stay ahead of the market with daily charts and insightful videos
Your secret to strategic trading!

JOIN HERE


Welcome to TradingLounge (ASIC A.R.No. 321187), specialists in trades, trading education and technical analysis, covering stocks, indices, commodities, forex and cryptocurrencies.

When you join TradingLounge you have access to everything we offer, including trade tools, educational content and a social platform to chat with like-minded investors.

Read more

@Copyright 2024 by tradinglounge.com

Contact Us

Australian no: 02 4787 6020

International no: +61 (2) 47876020

Pay with:

Find us on