16Aug

VanEck Semiconductor ETF (SMH) Stocks Elliott Wave Technical Analysis: Essential Insights into SMH's Current Market Structure and Wave Counts

Welcome to Our Elliott Wave Analysis for VanEck Semiconductor ETF (SMH) - August 16, 2024

This analysis provides insights into SMH's price movements using the Elliott Wave Theory, helping traders identify potential opportunities based on the current market structure and trends. We will examine both the daily and 1-hour charts to offer a comprehensive view of SMH's market behavior.

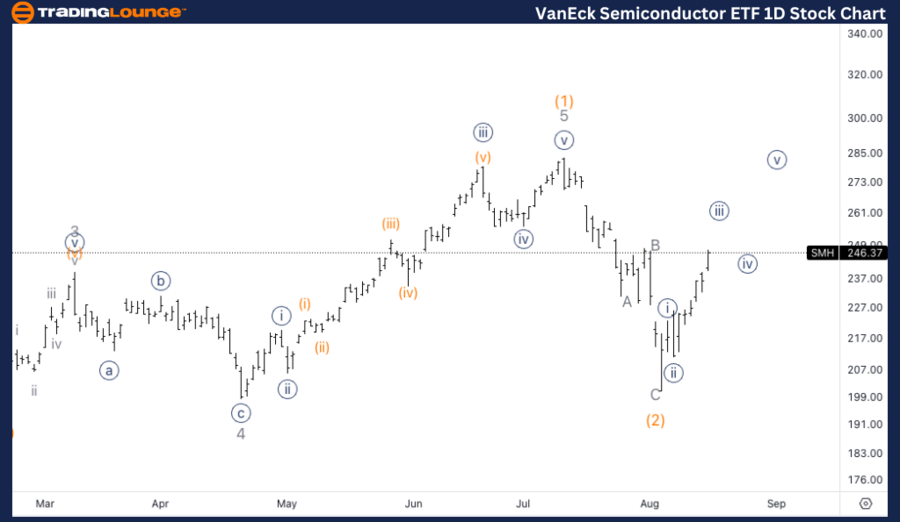
SMH Elliott Wave Analysis: Daily Chart Overview

VanEck Semiconductor ETF (SMH) Daily Chart Analysis

SMH Elliott Wave Technical Analysis

Function: Trend

Mode: Impulsive

Structure: Motive

Position: Wave 1 of (3)

Direction: Upside into wave 1

Details: We're observing a clear five-wave move from the $200 lows, which is essential for confirming the broader upside potential.

SMH Elliott Wave Technical Analysis – Daily Chart

The daily chart indicates a well-defined five-wave structure emerging from the recent $200 lows. This wave 1 of (3) is crucial in establishing the continuation of the broader upward trend. A confirmed five-wave move would bolster confidence in the ongoing trend, indicating that SMH is positioned for further gains as it moves into wave 3.

VanEck-Semiconductor...


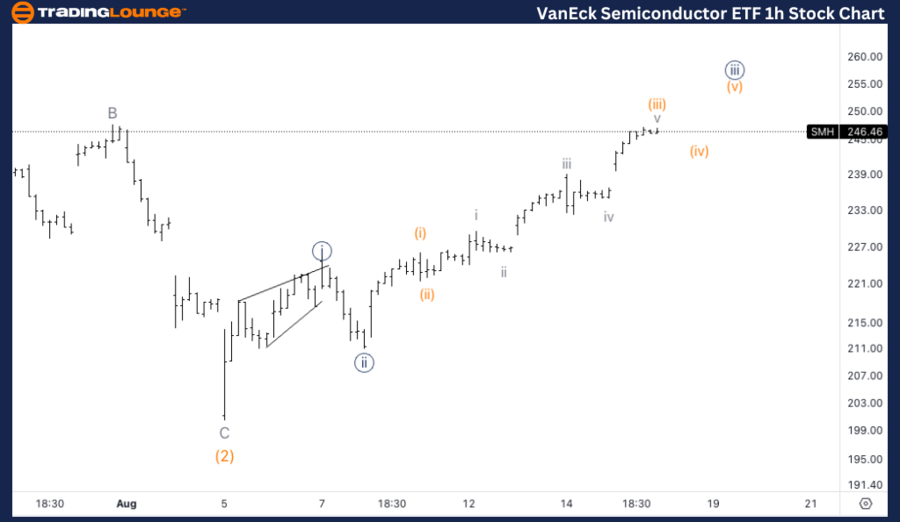
SMH Elliott Wave Analysis: 1-Hour Chart Overview

VanEck Semiconductor ETF (SMH) 1H Chart Analysis

SMH Elliott Wave Technical Analysis

Function: Trend

Mode: Impulsive

Structure: Motive

Position: Wave {iii} of 1

Direction: Upside in wave {iii}

Details: We anticipate further upside into wave {iii} as the price approaches the previous wave B level. A break above this resistance would confirm additional upside potential.

SMH Elliott Wave Technical Analysis – 1H Chart

In the short-term, SMH appears to be advancing within wave {iii} of 1. As we near the previous wave B level, a break above this resistance will provide further confirmation of the upward trend. This would reinforce the bullish outlook, signaling that wave {iii} is actively propelling the price higher.

Technical Analyst: Alessio Barretta

Source: visit Tradinglounge.com and learn From the Experts Join TradingLounge Here 

See Previous: NextEra Energy Inc., (NEE) Stocks Elliott Wave Technical Analysis

Special Trial Offer - 0.76 Cents a Day for 3 Months! Click here

Access 7 Analysts Over 170 Markets Covered. Chat Room With Support

VanEck-Semiconductor...

Related

Bitcoin Elliott WaveTechnical Analysis:Bitcoin Price Prediction and Uptrend Trading Insights

Bitcoin Elliott WaveTechnical Analysis:Bitcoin Price Prediction and Uptrend Trading Insights

Explore detailed Bitcoin Elliott Wave analysis and BTCUSD price predictions. Learn about Wave V, bul...

Read More >
Exxon Mobil Inc. (XOM) Stocks Elliott Wave Analysis: Stay updated with Technical analysis, and trading strategies for XOM

Exxon Mobil Inc. (XOM) Stocks Elliott Wave Analysis: Stay updated with Technical analysis, and trading strategies for XOM

Explore our in-depth Elliott Wave analysis for Exxon Mobil Inc. (XOM), featuring daily and 4-hour ch...

Read More >
Hang Seng Index Elliott Wave Analysis Reveals Bullish Trends and Market Forecast for Informed Trading Strategies

Hang Seng Index Elliott Wave Analysis Reveals Bullish Trends and Market Forecast for Informed Trading Strategies

The Hang Seng Index (HSI) exhibits a bullish trend as per Elliott Wave analysis, with Orange Wave 1 ...

Read More >
Gain expert insights into Dogecoin's market Crypto Price: DOGEUSD Elliott Wave Technical Analysis

Gain expert insights into Dogecoin's market Crypto Price: DOGEUSD Elliott Wave Technical Analysis

trends with our comprehensive Elliott Wave analysis. Learn about DOGEUSD technical analysis, trading...

Read More >
Bovespa Index Elliott Wave Analysis Shows Bullish Momentum With Wave 3 Advancing on Daily and Weekly Brazilian Market Charts

Bovespa Index Elliott Wave Analysis Shows Bullish Momentum With Wave 3 Advancing on Daily and Weekly Brazilian Market Charts

The Bovespa Index shows a bullish impulsive wave structure on both daily and weekly charts, signalli...

Read More >
SP500 & NASDAQ Insights: AAPL, AMZN, NVDA, TSLA, and More with Elliott Wave

SP500 & NASDAQ Insights: AAPL, AMZN, NVDA, TSLA, and More with Elliott Wave

### Summary The SP500 and NASDAQ are likely in the final stages of Wave iv), with no significant ...

Read More >

$1 for 2 Weeks

then $29 a month!

What a Special Offer!

Trade Recommendations

Unleash the power of deversified trading with our comprehensive portfolio, covering 250+ markets:

  • Stock Trades
  • Crypto Trades
  • Forex Trades
  • Commodity Trades
Elliott Wave Analysis

Gain a competitive edge with expert insights and AI-powered Elliott Wave charting into:

  • Global Indices
  • US Stocks & ASX Stocks
  • Forex & Crypto
  • Commodities
Top-Notch Trading Tools

Equip yourself with the tools of success:

  • Real-time Chat rooms
  • Elliott Wave Algorithm
  • Portfolio tools
  • TradingLevels
  • Screener
  • Trading Game
7 Elliott Wave Analysts

Stay ahead of the market with daily charts and insightful videos
Your secret to strategic trading!

JOIN HERE


Welcome to TradingLounge (ASIC A.R.No. 321187), specialists in trades, trading education and technical analysis, covering stocks, indices, commodities, forex and cryptocurrencies.

When you join TradingLounge you have access to everything we offer, including trade tools, educational content and a social platform to chat with like-minded investors.

Read more

@Copyright 2024 by tradinglounge.com

Contact Us

Australian no: 02 4787 6020

International no: +61 (2) 47876020

Pay with:

Find us on